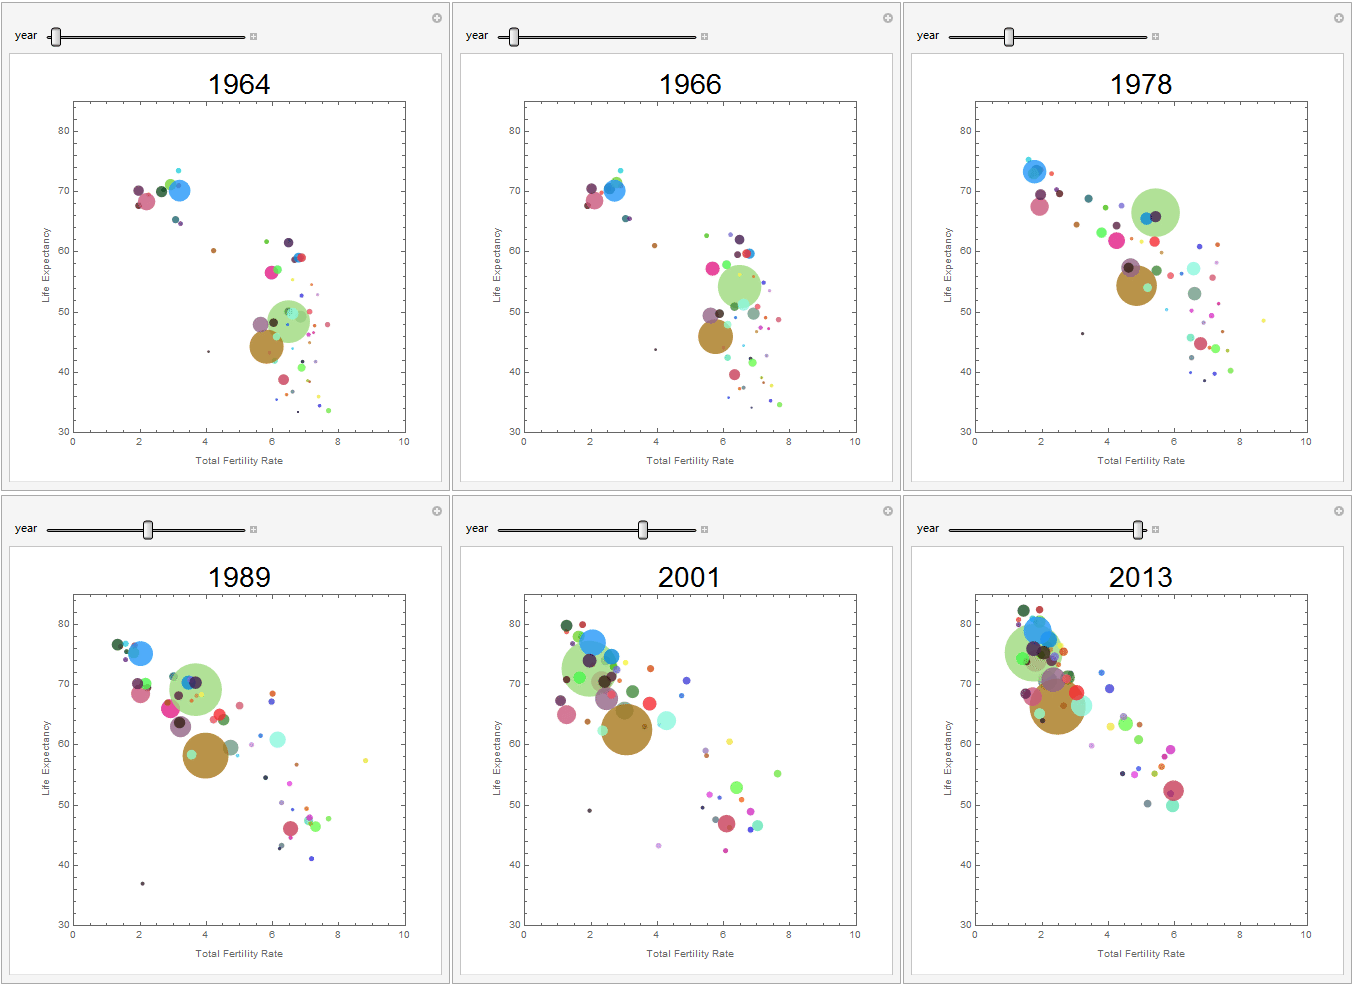
I was inspired by Hans Rosling talking on TED in 2006. The dynamic bubble chart tells a good story. His speech was recorded in 2006, so I am wondering what has changed after nearly 10 years later.
W|A provides same quality data and I should plot those data with BubbleChart, easily. Unfornately, BubbleChart has a very strange diameter, so I use Graphics instead, finally.
GIF shows below with totally 57 countries for time series from 1964 to 2013.
- each bubble stand for a country (diameter is population);
- biggest bubble is China, 2nd biggest is India, etc;
- x axis is total fertility rate, y axes is life expectancy;
- population less than 10 million are filtered. (If too less population, the point is really too small.);
- country history data is available from W|A

 Attachments: