For more difficult cases one can make a helper function that will check if a point belongs to a region or not. Here is a simple function that tries to do it numerically:
ClearAll[Envelope]
Envelope[f_, x_?NumericQ, y_?NumericQ, {a_?NumericQ, b_?NumericQ, n_Integer: 100}, comb_: Or] := comb @@ Table[f[x, y, z] > 0, {z, Subdivide[a, b, n]}]

f[x_, y_, z_] := x + z y + Sin[6 z];
Quiet@RegionPlot[Envelope[f, x, y, {-0.5, 0.5}], {x, -2, 2}, {y, -2, 2}]
Quiet@RegionPlot[Envelope[f, x, y, {-0.5, 0.5}, And], {x, -2, 2}, {y, -2, 2}]
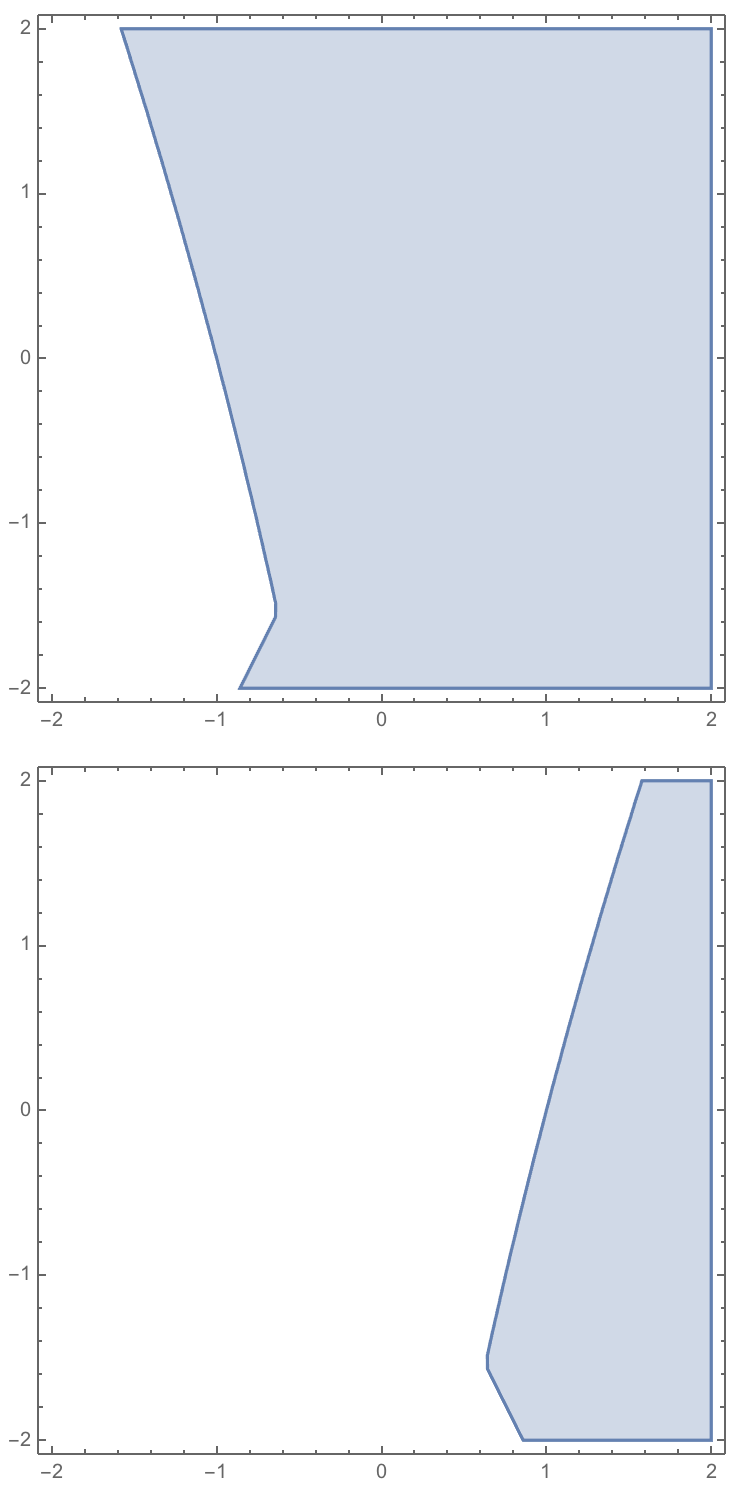
For this function one can not simply take the end points as the function is not monotonically increasing. This function will take several points of z and check if they belong to the set, and then using either OR or AND decide what to do.


