Group Abstract Group Abstract

Message Boards Message Boards

1
|
3.8K Views
|
3 Replies
|
6 Total Likes
View groups...
Share
Share this post:

Create a RegionPlot with an inequality over an intervall of a variable?

Posted 9 years ago
POSTED BY: Tobias Frohoff
3 Replies
Posted 9 years ago

That's exactly what I was looking for. My function is quiet difficult, so that I need your difficult case with "And" as logical operation.

Thanks a lot!

POSTED BY: Tobias Frohoff

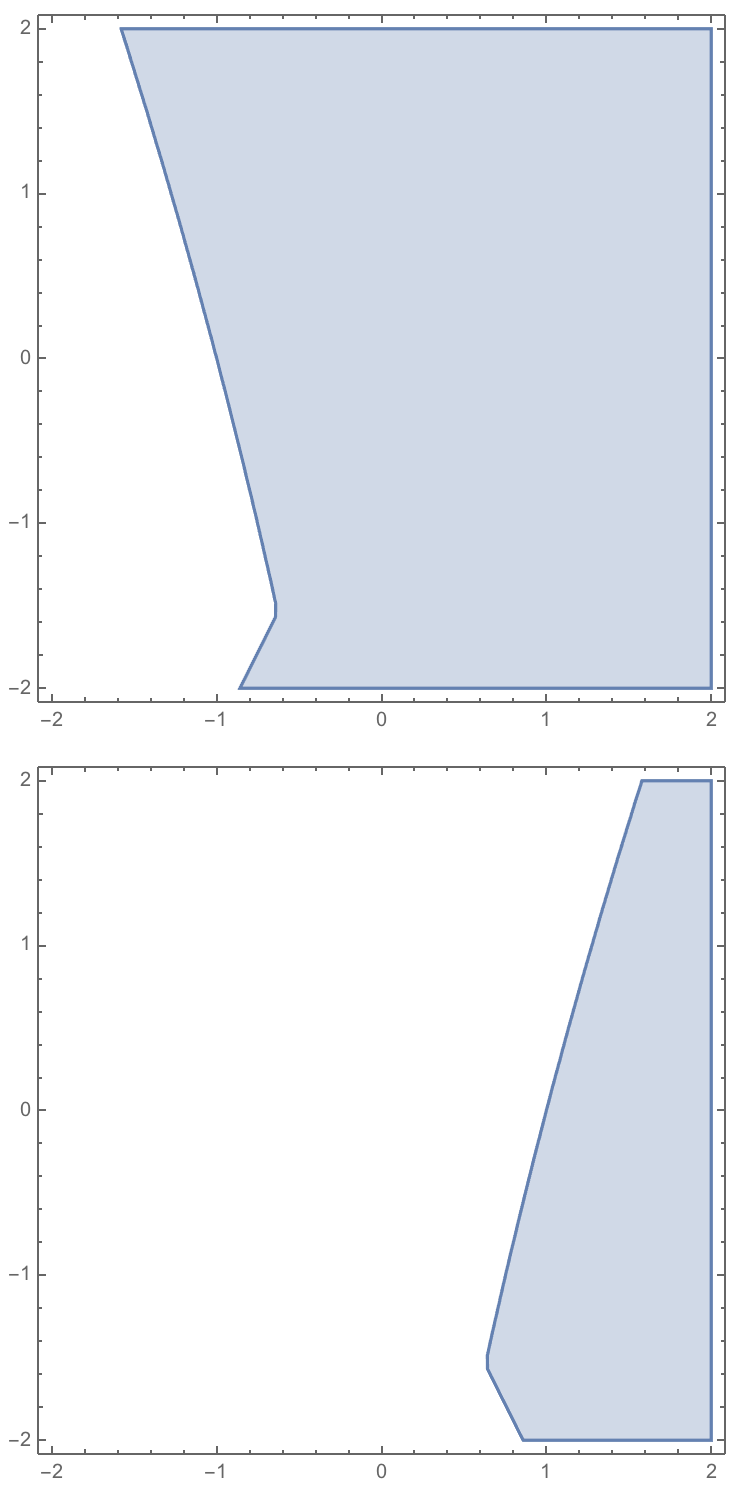
For more difficult cases one can make a helper function that will check if a point belongs to a region or not. Here is a simple function that tries to do it numerically:

ClearAll[Envelope]
Envelope[f_, x_?NumericQ, y_?NumericQ, {a_?NumericQ, b_?NumericQ, n_Integer: 100}, comb_: Or] := comb @@ Table[f[x, y, z] > 0, {z, Subdivide[a, b, n]}]

f[x_, y_, z_] := x + z y + Sin[6 z];
Quiet@RegionPlot[Envelope[f, x, y, {-0.5, 0.5}], {x, -2, 2}, {y, -2, 2}]
Quiet@RegionPlot[Envelope[f, x, y, {-0.5, 0.5}, And], {x, -2, 2}, {y, -2, 2}]
enter image description here

For this function one can not simply take the end points as the function is not monotonically increasing. This function will take several points of z and check if they belong to the set, and then using either OR or AND decide what to do.

POSTED BY: Sander Huisman

In general this can be very tricky, as you have to calculate what (I believe) is called an envelope. However you problem is not completely specified. Do you want to the inequality to hold for ALL z, or for SOME z? Depending on this the answer is different. Since you're function is easy one can just evaluate the end-points of 'z' and use logical operations on that:

f[x_, y_, z_] := x + y*z;
RegionPlot[f[x, y, 0.5] > 0 \[And] f[x, y, -0.5] > 0, {x, -2, 2}, {y, -2, 2}]
RegionPlot[f[x, y, 0.5] > 0 \[Or] f[x, y, -0.5] > 0, {x, -2, 2}, {y, -2, 2}]

enter image description here

POSTED BY: Sander Huisman
Reply to this discussion
Community posts can be styled and formatted using the Markdown syntax.
Reply Preview
Attachments
Remove
or Discard