Message Boards Message Boards

Coffee & milk with Arduino and Newton's law of cooling

Here is something that I do in my lectures regarding the coffee cooling problem. I use just standard Mathematica and a rather simple approach based on Newton's law for cooling. See also a related System Modeler post.

Newton's Law of Cooling

When Newton described the cooling for an object, he used the simple assumption that the change of the temperature of an object is proportional to the temperature difference of the environment and the object.

enter image description here

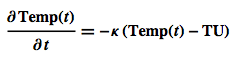
Here Temp(t) is the temperature of the object and TU is the temperature of the environment, e.g. the ambient air. The coefficient $\kappa$ indicates how fast the adaptation to the outside temperature takes place.

In Mathematica it looks like this:

sols = DSolve[{D[Temp[t], t] == -\[Kappa] (Temp[t] - TU), Temp[0] == T0}, Temp, t]

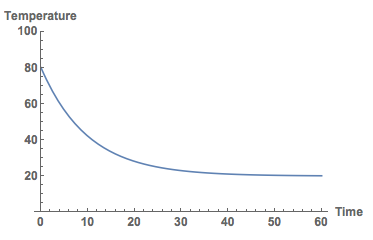
Here we assume that the starting temperature is T0. If we assume the starting temperature to be 80 degrees C and the air temperature to be 20 degrees C, and $\kappa=0.1$ we obtain the following plot.

Plot[Temp[t] /. sols /. {\[Kappa] -> 0.1, TU -> 20, T0 -> 80}, {t, 0, 60}, PlotRange -> {All, {0, 100}}, 
AxesLabel -> {"Time", "Temperature"}, LabelStyle -> Directive[Bold, Medium]]

enter image description here

In fact, if we had data we could determine the value for $\kappa$ from experiments.

When do I put the milk in my coffee?

So here's the question. If I am in a hurry in the morning and need to catch a bus. I love my coffee but do not want to burn my lips. When do I pour the cold milk in? As early on as I can or just before I need to leave the house?

We can easily model the adding of milk to some coffee by using the WhenEvent function:

sols = NDSolve[{D[Temp[t], t] == -0.1 (Temp[t] - 20), Temp[0] == 80, WhenEvent[t > 1, Temp[t] -> (200. Temp[t] + 50.* 5.)/250.]}, Temp, {t, 0, 30}]

it uses a simplified version of the law that governs the mixing of fluids (same calorific capacities).

enter image description here

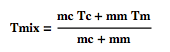
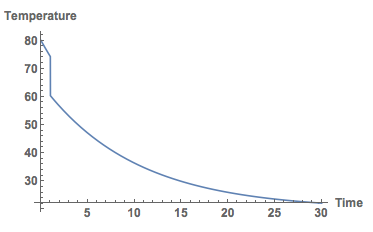
where Tmix is the temperature of the resulting coffee-milk mix, mc and mm are the mass of the coffee and the milk, and Tc and Tm their respective temperatures. Note that the model is not quite correct in the sense that it does not take into consideration that the mass of the content of the mug has changed after the milk is added. First we put the milk in right at the beginning:

sols = NDSolve[{D[Temp[t], t] == -0.1 (Temp[t] - 20), Temp[0] == 80, 
   WhenEvent[t > 1, Temp[t] -> (200. Temp[t] + 50.* 5.)/250.]}, 
  Temp, {t, 0, 30}]

Here's the graph.

Plot[Temp[t] /. sols, {t, 0, 30}, PlotRange -> All, AxesLabel -> {"Time", "Temperature"}, LabelStyle -> Directive[Bold, Medium]]

enter image description here

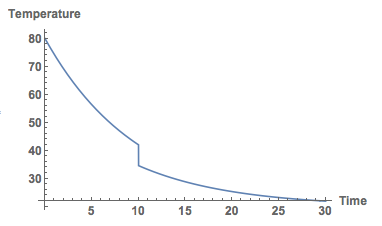
Next we wait for 10 minutes and then pour the milk in:

sols2 = NDSolve[{D[Temp[t], t] == -0.1 (Temp[t] - 20), Temp[0] == 80, WhenEvent[t > 10, Temp[t] -> (200.* Temp[t] + 50.* 5.)/250.]}, Temp, {t, 0, 30}]

Here's the plot:

Plot[Temp[t] /. sols2, {t, 0, 30}, PlotRange -> All, AxesLabel -> {"Time", "Temperature"}, 
 LabelStyle -> Directive[Bold, Medium]]

enter image description here

If we plot both together we get this:

Show[Plot[Temp[t] /. sols, {t, 0, 30}, PlotRange -> All], Plot[Temp[t] /. sols2, {t, 0, 30}, PlotRange -> All], 
AxesLabel -> {"Time", "Temperature"}, LabelStyle -> Directive[Bold, Medium]]

enter image description here

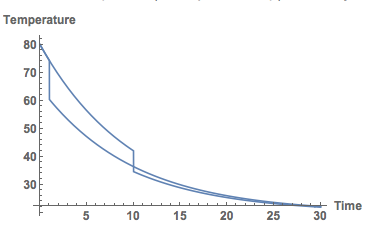
Clearly, I should put my milk in as late as possible. Well, that's the model.

Getting data for our model

Let's get some data with an Arduino and a simple temperature sensor. We use a standard Arduino Uno and wire it like so:

enter image description here

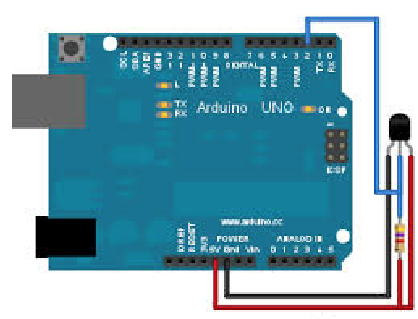
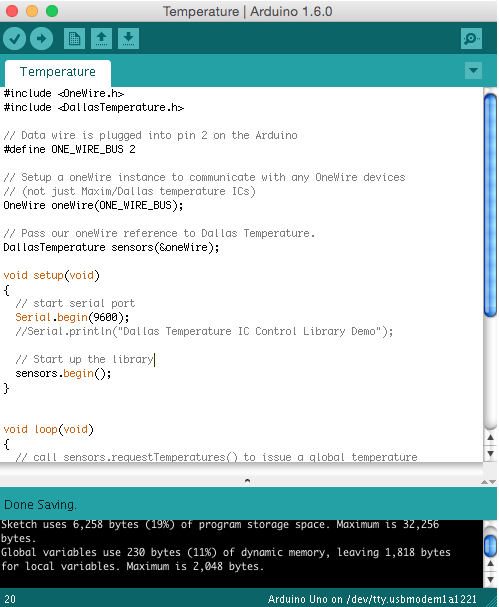
I use a standard Arduino and a Dallas Temperature Sensor. We then need to upload an Arduino C-program, which is called Sketch, to the microcontroller.

#include <OneWire.h>
#include <DallasTemperature.h>

// Data wire is plugged into pin 2 on the Arduino
#define ONE_WIRE_BUS 2

// Setup a oneWire instance to communicate with any OneWire devices 
// (not just Maxim/Dallas temperature ICs)
OneWire oneWire(ONE_WIRE_BUS);

// Pass our oneWire reference to Dallas Temperature.
DallasTemperature sensors(&oneWire);

void setup(void)
{
  // start serial port
  Serial.begin(9600);

  // Start up the library
  sensors.begin();
}


void loop(void)
{

  sensors.requestTemperatures(); // Send the command to get temperatures

  Serial.print(sensors.getTempCByIndex(0),4); 
  Serial.print(",");
}

The upload is done via the Arduino IDE. (I could do it directly from within Mathematica.)

enter image description here

The Arduino is connected via a serial (i.e. USB) cable to the computer. Mathematica can connect to the serial port like so (on a Mac, slightly different on a Windows machine):

myDSTemperature = 
 DeviceOpen["Serial", {Quiet[FileNames["tty.usb*", {"/dev"}, Infinity]][[1]], "BaudRate" -> 9600}]

We can then run a ScheduledTask every second:

s = {}; tZero = AbsoluteTime[]; DeviceReadBuffer[myDSTemperature];
RunScheduledTask[
AppendTo[s, {AbsoluteTime[] - tZero, ToExpression@(StringSplit[FromCharacterCode@DeviceReadBuffer[myDSTemperature], ","][[-1]])}], 1]

We can then display the result dynamically:

Dynamic[ListLinePlot[s, PlotRange -> {All, {20, 40}}]]

After that you might want to stop the Scheduled task and close the connection:

RemoveScheduledTask /@ ScheduledTasks[];
DeviceClose[myDSTemperature]

I have attached the measurements I obtained for my experiment. You can load and display it like this:

ClearAll["Global`*"]

data = Import["~/Desktop/temperaturedata_CoffeMilkGood.csv"];
dataclean = Table[Join[{data[[k]][[1 ;; 6]]}, data[[k]][[7 ;; 9]]], {k, 1, Length[data]}];
data2plotearlymilk = Select[Transpose[{dataclean[[All, 1]], dataclean[[All, 3]]/1000.}], #[[2]] > 0 &];
data2plotlatemilk = Select[Transpose[{dataclean[[All, 1]], dataclean[[All, 2]]/1000.}], #[[2]] > 0 &];

DateListPlot[{data2plotearlymilk, data2plotlatemilk}, PlotRange -> {All, {0, 100}}, Joined -> True, 
FrameLabel -> {"Time", "Temperature"}, LabelStyle -> Directive[Bold, Medium]]

enter image description here

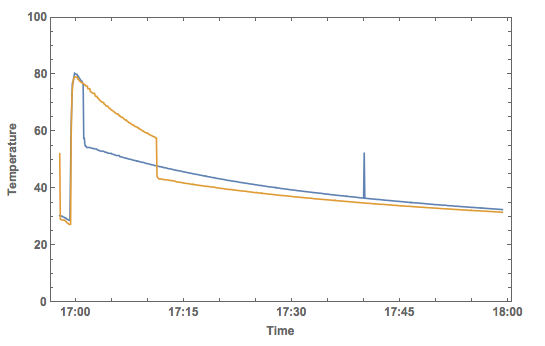
There is clearly one measurement error at the blue curve, but it does appear to show that there is a better chance of not burning my lips if I put the milk in as late as I can.

Note that I have assumed that the air temperature does not change. In fact, I also measured the air temperature when I did the experiment - it is constant as expected.

As I said, I know that this is not really addressing the original question, but when I teach mathematical modelling, I always like showing the students that is quite relevant to compare the models to data.

Cheers,

Marco

Attachments:
POSTED BY: Marco Thiel
7 Replies
Posted 7 years ago

Greetings Marco, I have taken the liberty of combining your scripts into one Mathematica Manipulates. Basic initial conditions with ranges:

  • Coffee 80 ?C
  • 50 to100?C
  • Milk 5?C
  • 1?C to ambient
  • Ambient /room temperature 20?C
  • 0?C to 30?C
  • Length of experiment in minutes 30
  • 1 minute to 100 minutes
  • Time to add milk 1 minute
  • 1 minute to 100 minutes
  • Volume of coffee 200ml
  • 100ml to 500ml
  • Volume of milk 20 ml
  • 0 ml to 50ml

Code:

Manipulate[
 {
  sols = NDSolve[{
     D[Temp[t], t] == -0.1 (Temp[t] - ambient),
     Temp[0] == beginTemp,
     WhenEvent[
      t > addMilk,
      Temp[t] -> (coffee*Temp[t] + milk*milkTemp)/(coffee + milk)]},
    Temp,
    {t, 0, experimentTime}
    ];
  Plot[
   Temp[t] /. sols, {t, 0, experimentTime},
   PlotRange -> {{0, experimentTime}, {0, beginTemp + 10}},
   AxesLabel -> {"Time (minutes)", "Temperature  ?C"},
   LabelStyle -> Directive[Bold, Medium],
   ImageSize -> {{400, 600}}]
  },
 {{ambient, 20, "Ambient temperature"}, 0, 30, 0.5, 
  Appearance -> "Labeled"},
 {{experimentTime, 30, "Time of Experiement(minutes)"}, 1, 100, 0.5, Appearance -> "Labeled"},
 {{beginTemp, 80, "Coffee start temperature"}, 50, 100, 0.5, Appearance -> "Labeled"},
 {{milkTemp, 5, "Milk start temperature"}, 1, ambient, 0.5, Appearance -> "Labeled"},
 {{addMilk, 1, "Time to add milk(minutes)"}, 1, 100, 1, Appearance -> "Labeled"},
 {{coffee, 200, "Coffee volume (ml)"}, 100, 500, 10, Appearance -> "Labeled"},
 {{milk, 20, "Milk volume (ml)"}, 0, 50, 5, Appearance -> "Labeled"},
 ControlPlacement -> Left
 ]
POSTED BY: Updating Name
Posted 6 years ago

apologies for not including my details.

POSTED BY: Gary Bass

Dear Marco,

very nice - thanks for sharing! And a good thing you supplied the measured data.

For me the most interesting question is: How well does Newtons "simple model" agree with reality anyway? So I extracted the exponential part of the "early milk data" and made a fit:

ClearAll["Global`*"]

data = Import[
   "<your path>  CoffeMilkGood.csv"];
dataclean = Table[Join[{data[[k]][[1 ;; 6]]}, data[[k]][[7 ;; 9]]], {k, 1, Length[data]}];
data2plotearlymilk = Select[Transpose[{dataclean[[All, 1]], dataclean[[All, 3]]/1000.}], #[[2]] > 0 &];

coolingData = {AbsoluteTime[#1], #2} & @@@ data2plotearlymilk[[32 ;;]];
t0 = AbsoluteTime[coolingData[[1, 1]]];
coolingData = Delete[{(#1 - t0)/3600, #2} & @@@ coolingData, 395];

model = First[temp[t] /. DSolve[{D[temp[t], t] == -\[Kappa] (temp[t] - tempEnv), temp[0] == temp0}, temp[t], t]]

params = FindFit[coolingData, model /. temp0 -> 54.812`, {\[Kappa], tempEnv}, t]

coffeeTemp[t_] = model /. params /. temp0 -> 54.812`

The agreement seems to be remarkably good:

enter image description here

I guess these differences are well within the accuracy of measurement. The only real discrepancy is concerning the temperature of the environment: You measured 25°C and from the fit one gets 27.94°C (quite hot anyway, we have winter after all). Can this be explained by some measurement issues - or is this actually showing the limitation of the model?

Best regards -- Henrik

POSTED BY: Henrik Schachner

Dear Henrik,

very good observation as always. I am not quite sure. You are absolutely right: 27.94°C is too hot. The measurement was done quite some time ago (I think that file says that it was taken on 24. February 2014 a couple of minutes before 5pm. (I did not actually post this, but it was taken from a reply I posted to a question here on the community, and I had the data from my lectures...)

The thing is that we recorded this at the University of Aberdeen and

== weather aberdeen 24.2.2014

gives

enter image description here

The heating at the University is good but I do not know how it would get the temperature up to 25°C never mind 28 °C. This year the outside temperature on 22 February was approximately the same as 24 Feb 2014 and I got these measurements from my office:

enter image description here

So an average office might have reached 23°C -24°C. I did the measurements during a lecture, There were several projectors on and quite some computer equipment for the video conferencing (the lectures are broadcast). I also had a water cooker on the desk with boiling water. I might have be stupid enough to put the mug with the coffee (actually water) under a document camera (light directly on it) and might have placed the ambient temperature sensor too far away. I suppose that that might explain 2-3°C.

  • Also, I have not modelled the effect of the coffee mug (which was ambient temperature at the start of the experiment).
  • I also haven't included the changed volume of the liquid (I added a substantial amount of cold water, to make the effect visible). Surface to volume ratio might have changed.
  • In rare cases, I have observed a temperature offset with this particular type of temperature sensor - though not as large.
  • I did not stir the water. So the temperature sensor might have picked up something something different from the "average" temperature of the water.

There might be other effects as well. I think that the main problem is that this was an experiment during my lectures to show the students the principle of the modelling/data validation procedure. It was not a high precision experiment and I was not very careful.

If you want I can ask a student to repeat the experiment and try to get better data. It would be interesting to see what happens.

Best wishes, Marco

POSTED BY: Marco Thiel

Dear Marco,

thank you for your detailed response! Clearly the temperature for Aberdeen in winter is too high - as it is in Germany. At the moment I am at a conference in Austria (near Schladming), and it is much too warm as well - even without hot coffee. No promising perspectives for winter sport ...

I definitely do not want to initiate any extra work for anybody! Obviously I was a bit sleepy when I wrote my post: Of course the hot cup is warming up its immediate surrounding if no special measures against are taken. So I think the seemingly higher temperature in this surrounding does make sense here, and - as final result for me - we obviously see that Newtons approach works quite well.

Best regards -- Henrik

POSTED BY: Henrik Schachner

Excellent post Marco! Very nice! And nice reply by Henrik!

The fit of the model and the measurement are remarkable good in agreement! Despite the fact you only consider conductive heat transport. There is radiative heat-energy scaling as T^4, there is thermal convection (a la Rayleigh Benard) inside the mug, evaporation, .... et cetera!

POSTED BY: Sander Huisman

enter image description here - Congratulations! This post is now a Staff Pick! Thank you for your wonderful contributions. Please, keep them coming!

We have also split your post into a separate discussion as it won our editorial selection. The original discussion still has a comment linking here. Thank you!

POSTED BY: Moderation Team
Reply to this discussion
Community posts can be styled and formatted using the Markdown syntax.
Reply Preview
Attachments
Remove
or Discard

Group Abstract Group Abstract