I have encountered a very minor issue when I used the new StackListPlot with the option PlotLayout -> "Percentile" on my laptop. Could anyone please try to reproduce the issue?
data = RandomInteger[10, {3, 100}];
Column[{StackedListPlot[data, PlotLayout -> "Percentile", ImageSize -> Large],
StackedListPlot[data + 0.0000001, PlotLayout -> "Percentile", ImageSize -> Large]}]
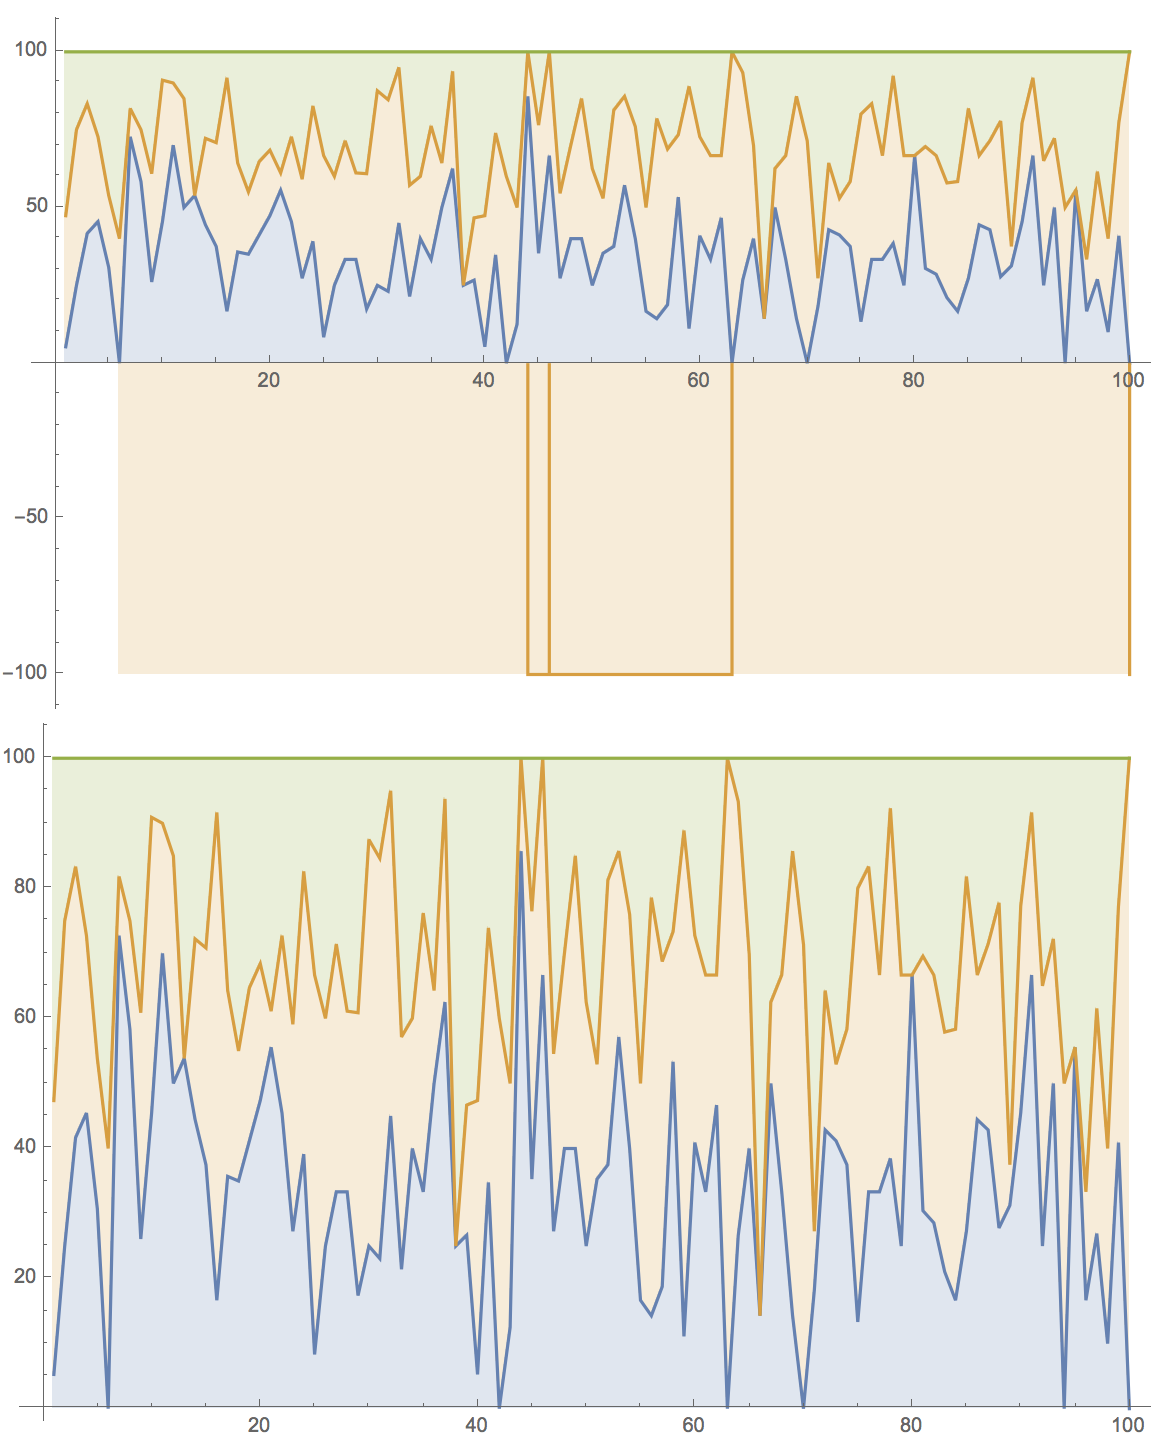
The first image shows what I suppose is unwanted behaviour of the function. It appears that this happens when there are zeros in the sequence and when the option PlotLayout->"Percentile" is used there are unexpected excursion of the curves to negative values. It might be related to the rescaling the is required for the percentile plot. When I add a small positive number to all values (see second plot) the issue disappears and the plot looks somewhat more like what I would expect.
I have found this on a couple of machines (all OSX) obviously in version 11.2:
Could anyone please try to reproduce this on their machines?
Best wishes and thank you,
Marco


