Message Boards Message Boards

Is GeoHistogram allowing bspec defined as a GeoVariants entities list?

Posted 7 years ago

Hi everyone, I wanted to plot a GeoHistogram at World Range with a different color for every country. Everything works fine as long as I set as bspec (bin specification) the entity "Country". The problem is, for instance, that the "UnitedStates" country does not include Alaska and Hawaii, but I know that you can define an entity that includes them like this

GeoVariant[CountryData["UnitedStates"],"PrincipalArea"]

So I tried to define a bspec list of this GeoVariant entities for plotting, but it doesn't work. Does anyone know a workaround to solve this problem?

POSTED BY: Gianluca Teza
3 Replies
Posted 7 years ago

I almost got it. The idea scheme is:

  1. Find the maximum and minimum values of the data you have;
  2. Normalize the values in a range within 0 and 1;
  3. Create a list of color with the ColorData function starting from the normalized values;
  4. Thread the countries list over the color list to obtain a "country->color" list;
  5. Plot with GeoRegionalValuePlot.

For instance, with the same data used in the example of the previous post we have:

countries = {CountryData[012], CountryData[024], CountryData[304], 
   GeoVariant[CountryData[840], "PrincipalArea"]};
values = {1.4, 2.6, 2.8, 3.5};
maxv = Max[values];
minv = Min[values];
normvalues = (values - minv)/(maxv - minv);
colors = ColorData["Rainbow", "ColorFunction"][#] & /@ normvalues;
data = Thread[countries -> colors];
GeoRegionValuePlot[data]

enter image description here

The only thing missing now is a legend of the color scheme with the original (non-normalized) values. Is it possible to add it manually?

Thanks again, best regards

Gianluca

POSTED BY: Gianluca Teza
Posted 7 years ago

Hi Emmanuel,

first of all thanks for your kind and detailed answer. I tried what you suggested but when i give the GeoHistogram command it gives me an error again saying "{{Polygon[....some stuff....]}}is not a valid bin specification" (by the way I am using mathematica 11.1 student edition under GNU/Linux).

However I think there might be another workaround that involves GeoRegionValuePlot: if I define my data like

data = {CountryData[012] -> 1.4, CountryData[024] -> 2.6, 
   CountryData[304] -> 2.8, 
   GeoVariant[CountryData[840], "PrincipalArea"] -> 3.5};

I am able to plot them with

GeoRegionValuePlot[data, ColorFunction -> "Rainbow"]

obtaining this result

enter image description here

However the one thing I'm missing in this way is the color density I was obtaining with GeoHistogram. Here it seems like there is a binning for the color gradient and if a value falls within a certain bin limits then a color is given (see for instance Greenland and Angola showing the same greenish color even though their values are different).

If there's an easy way to increase the the binning density (or, if possible, making it continuous) I think that it would solve completely my problem. Thanks in advance, best regards

Gianluca

POSTED BY: Gianluca Teza

Hi,

That is a bug and we are working on a better parsing. We actually support FilledCurves bins or a list of Polygons, but not mixed. Thanks for noticing it.

The USA GeoVariant includes 15 objects (Polygons and FilledCurves). For some reason the last polygon gives problems and most of the USA area is covered by FilledCurves, so we can convert those FilledCurves into Polygons (excluding gaps) and from there we can feed GeoHistogram with Polygonal bins only.

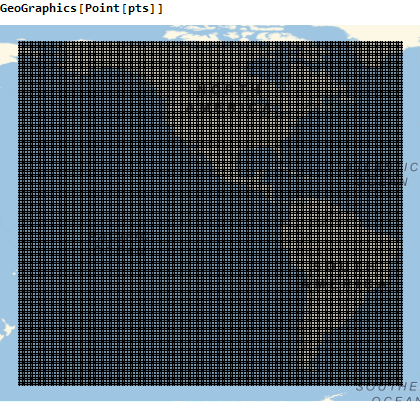
First, say you have this set of points:

pts = GeoPosition[
   Table[{lat, lon}, {lat, -60, 70}, {lon, -180, -35}]];

Now, if you plot those points you get:

enter image description here

As I mentioned, you can get the main USA area by:

USPolygons = 
  Cases[EntityValue[
     GeoVariant[CountryData["UnitedStates"], "PrincipalArea"], 
     "Polygon"], 
   FilledCurve[{{Line[g_]}, ___}] :> Polygon[g]];

And other countries polygons are:

otherCountries = 
  Table[Polygon /@ 
    GeoPosition /@ 
     First[First[
       EntityValue[CountryData[country], 
        "Polygon"]]], {country, {"Mexico", "Canada", "Brazil", "Peru",
      "Argentina", "Chile"}}];

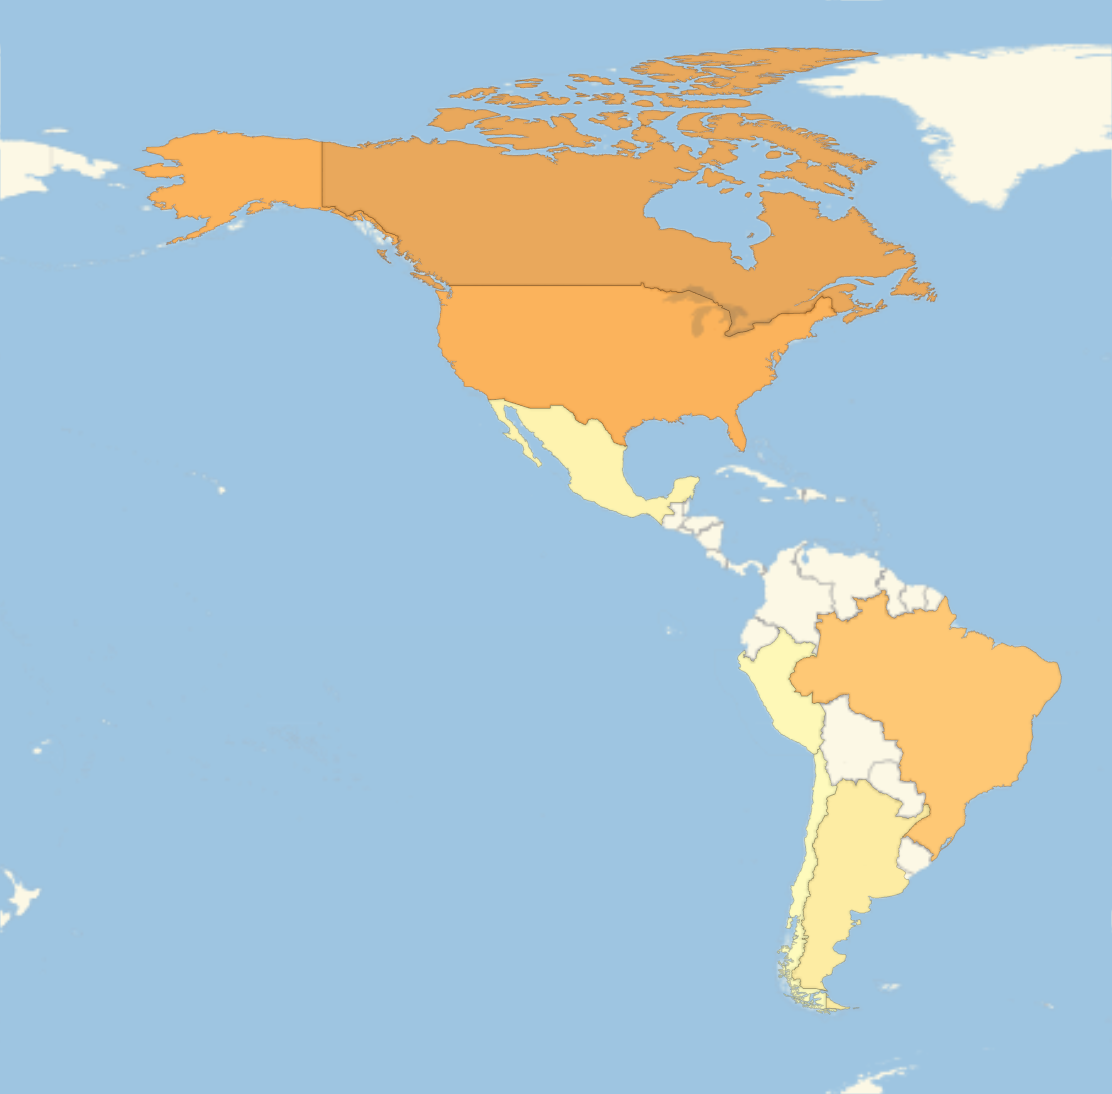
Then use GeoHistogram by combining the polygons from USA and the polygons from other countries:

GeoHistogram[pts, {USPolygons, Sequence @@ otherCountries}]

enter image description here

I hope this is helpful.

Best regards, Emmanuel

POSTED BY: Emmanuel Garces
Reply to this discussion
Community posts can be styled and formatted using the Markdown syntax.
Reply Preview
Attachments
Remove
or Discard

Group Abstract Group Abstract