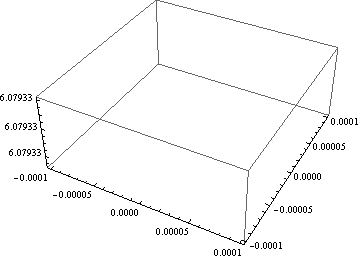
A normal plot of the function seems to be working fine. I'm also pretty certain that there is no infinity or so.
(* ::Package:: *)
gs=1;
rs=10.000000000000000;
vte=0.025864186384551461;
csat=1.0000000000000000*10^-014;
cktCKTgmin=9.9999999999999998*10^-013;
hereDIOtBrkdwnV=-0.65509939013317497;
hereDIOtDepCap=0.50000000000000000;
modelDIOjunctionPot=1.0000000000000000;
modelDIOgradingCoeff=0.50000000000000000;
modelDIOtransitTime=9.9999999999999998*10^-013;
modelDIOf2=0.35355339059327379;
hereDIOtF1=0.58578643762690485;
czero=2.0000000000000000*10^-012;
modelDIOf3=0.25000000000000000;
omega=2*Pi*10^6;
(*
t0=0;
h=10^-8;
*)
smoothMax[tx_, tm_, ts_]:=tm + Log[1 + Exp[(tx - tm)*ts]]/ts
smoothMin[tx_, tm_, ts_]:=tm - Log[1 + Exp[(tm - tx)*ts]]/ts
glue[tx_, ts_]:=((Exp[tx*ts] - Exp[-tx*ts])/(Exp[tx*ts] + Exp[-tx*ts] + 1)+1)/2
current[VD_]:=(csat*(Exp[VD/vte] - (1)) + cktCKTgmin*VD)
charge1[VD1_]:=(czero*hereDIOtF1 + czero/modelDIOf2*(modelDIOf3*(VD1 - hereDIOtDepCap)+ (modelDIOgradingCoeff/( modelDIOjunctionPot+ modelDIOjunctionPot))*(VD1*VD1 - hereDIOtDepCap*hereDIOtDepCap)))
charge0[VD0_]:=(modelDIOjunctionPot*czero*(1- Exp[(1 - modelDIOgradingCoeff)*Log[1 - VD0/modelDIOjunctionPot]]) /(1 - modelDIOgradingCoeff))
charge2[x_]:=glue[-(x - hereDIOtDepCap), gs]*charge0[smoothMin[x, hereDIOtDepCap, gs]]+ glue[x - hereDIOtDepCap, gs]*charge1[smoothMax[x, hereDIOtDepCap, gs]]
charge3[current_]:=(modelDIOtransitTime*current)
charge[VD_]:=charge3[current[VD]] + charge2[VD]
chargecurrent[v2_, v2t_]:=(D[charge[v22], v22]/.v22->v2)*v2t
v[t_, omega_]:=Sin[omega*t]/2
rest11[t_, i1_, v2_, v2t_, omega_, current1_, chargecurrent1_, v_]:=(i1 - (v - v2)/rs)^2+((v - v2)/rs - current1 - chargecurrent1)^2
i1[t_, t0_, a1_, b1_, c1_, d1_]:=a1+b1*(t-t0) + c1*(t - t0)^2 + d1*(t - t0)^3
v2[t_, t0_, a3_, b3_, c3_, d3_]:=a3+b3*(t-t0) + c3*(t - t0)^2 + d3*(t - t0)^3
v2t[t_, t0_, a3_, b3_, c3_, d3_]:=D[v2[tt, t0, a3, b3, c3, d3], tt]/.tt->t
rest22[t_, t0_, a1_, b1_, c1_, d1_, a3_, b3_, c3_, d3_, omega_]:=rest11[
t,
i1[t, t0, a1, b1, c1, d1],
v2[t, t0, a3, b3, c3, d3],
v2t[t, t0, a3, b3, c3, d3],
omega,
current[
v2[t, t0, a3, b3, c3, d3]
],
chargecurrent[v2[t, t0, a3, b3, c3, d3], v2t[t, t0, a3, b3, c3, d3]],
v[t, omega]
]
SERIES1[a1_, b1_, c1_, d1_, a3_, b3_, c3_, d3_, t1_, h_]:=Integrate[
Series[
rest22[t, t1, a1, b1, c1, d1, a3, b3, c3, d3, omega],
{t, t1, 8}],
{t, t1, t1 + h}];
h=10^-7;
a1=0;
b1=0;
c1=0;
d1=0;
a3=0;
b3=0;
c3=0;
d3=0;
p={};
(*
For[t1=0.0, t1 < 10^-5, t1 = t1 + h,
result=Minimize[
SERIES1[a1, b11, c1, d1, a3, b31, c3, d3, t1, h/100]/h*100,
{b11, b31}
];
Print[result];
b1=Last[result[[2]][[1]]];
b3=Last[result[[2]][[2]]];
result=Minimize[
SERIES1[a1, b1, c11, d1, a3, b3, c31, d3, t1, h/10]/h*10,
{c11, c31}
];
Print[result];
c1=Last[result[[2]][[1]]];
c3=Last[result[[2]][[2]]];
result=Minimize[
SERIES1[a1, b1, c1, d11, a3, b3, c3, d31, t1, h]/h,
{d11, d31}
];
Print[result];
d1=Last[result[[2]][[1]]];
d3=Last[result[[2]][[2]]];
(*
Print["t1=", t1];
Print[",a1=", a1, ",b1=", b1, ",c1=", c1, ",d1=", d1];
Print[",a2=", a2, ",b2=", b2, ",c2=", c2, ",d2=", d2];
Print[",a3=", a3, ",b3=", b3, ",c3=", c3, ",d3=", d3];
Plot[i1[t, t1, a1, b1, c1, d1], {t, t1, t1+h}];
*)
If[p!={},
p = Append[p, {a1+b1*(t-t1)+c1*(t-t1)^2+d1*(t-t1)^3, t1<t<t1+h}],
p = {{a1+b1*(t-t1)+c1*(t-t1)^2+d1*(t-t1)^3, t1<t<t1+h}}];
Print[p];
(*Print[Plot[Piecewise[p], {t, 0, t1+h}]];*)
a1=a1 + b1*h + c1*h^2 + d1*h^3;
a3=a3 + b3*h + c3*h^2 + d3*h^3;
];
Plot[Piecewise[p], {t, 0, 10^-5}]
*)
Print["start"];
SERIES2[b11_, b31_]:=SERIES1[a1, b11, c1, d1, a3, b31, c3, d3, 0, h]
Print["start1"];
Plot3D[SERIES2[b11, b31]*10^11, {b11, -0.0001, 0.0001}, {b31, -0.0001, 0.0001}]
(*
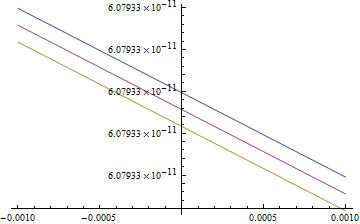
Plot[{SERIES2[b11, -0.001], SERIES2[b11, 0], SERIES2[b11, 0.001]}, {b11, -0.001, 0.001}]
*)
Print["start2"];
SERIES2[0, 0]

uncommenting the Plot command gives a useful 2d-plot:

and I think I found a workaround:
Plot3D[SERIES2[b11, b31]*10^11-6.07933, {b11, -0.0001, 0.0001}, {b31, -0.0001, 0.0001}]
[\mcode]
gives a non empty plot. Potentially 6.07933 is interpreted as a magic number?!