Message Boards Message Boards

0
|
8553 Views
|
4 Replies
|
5 Total Likes
View groups...
Share
Share this post:

Drawing tangent line on x*Log[Abs[x]]

Posted 6 years ago

Hello,

i want to draw x*Log[Abs[x]] with it tangent to show it approaches infinity in zero.

I tried with this :

Manipulate[
 Show[
  Plot[x*Log[Abs[x]], {x, -1, 1}, PlotRange -> All],
  Plot[g'[p] (x - p) + g[p], {x, p - 1, p + 1}, 
   PlotStyle -> {Thick, Orange}, PlotRange -> All]]

 , {p, -1, 1}]

But it don't show the tangent with this error :

General::stop: Further output of Infinity::indet will be suppressed during this calculation.
Infinity::indet: Indeterminate expression 0 (-\[Infinity]) encountered.

How can I do that on Mathematica to show this tangent with the discontinuity in zero ?

Thanks for help

POSTED BY: Clement Roblin
4 Replies
Posted 6 years ago

Hello, i did it with x*Log[RealAbs[x]] and it works perfectly !

Thanks !

POSTED BY: Clement Roblin

If you are using version 11.1 or later you can define

g[x_] = x*Log[RealAbs[x]]

Otherwise use Piecewise to avoid that derivative of g be calculated on the complexes.

POSTED BY: Gianluca Gorni

@Clement Roblin, welcome to Wolfram Community! Please make sure you know the rules: https://wolfr.am/READ-1ST

The rules explain how to format your code properly. If you do not format code, it may become corrupted and useless to other members. Please EDIT your posts and make sure code blocks start on a new paragraph and look framed and colored like this.

int = Integrate[1/(x^3 - 1), x];
Map[Framed, int, Infinity]

enter image description here

POSTED BY: Moderation Team

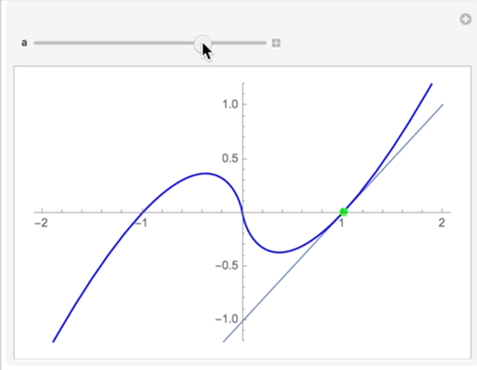
Clement, you should post code using the code formatting box (upper left icon) so it is more useful and readable when you post. Your function is indeterminate at x=0, however if you take the Limit[ ] as x->0 it goes to 0 as x->0. Using this fact you can construct a peicewise function and manipulate it:

g[x_] := Piecewise[{{x*Log[x], x > 0}, {x*Log[-x], x < 0}, {0, 
    x == 0}}]; Manipulate[
 With[{tl = Normal@Series[g[x], {x, a, 1}]}, 
  Show[Plot[{tl, g[x]}, {x, -2, 2}, 
    PlotStyle -> {Thickness[0.003], Blue}, PlotRange -> {-1.2, 1.2}], 
   Graphics[{Green, PointSize[0.02], Point[{a, g[a]}]}]]], {{a, 
   1}, -2, 2}]

This gives you the plot of the function and its tangent. The trick with the Normal@Series[g[x],{x,a,1}]... generates the Taylor series out to the first derivative and chops it at the first derivative. (I saw this on a post here once but I do not remember who posted it -- apologies to the clever author!). This is a cool way to get the tangent because you always get a function for a line -- its independent of the function whereas derivative will be a general function and you then must construct a line.

enter image description here

POSTED BY: Neil Singer
Reply to this discussion
Community posts can be styled and formatted using the Markdown syntax.
Reply Preview
Attachments
Remove
or Discard

Group Abstract Group Abstract