Click on the image to zoom. Then click your browser back button to return to reading the post.

Intro
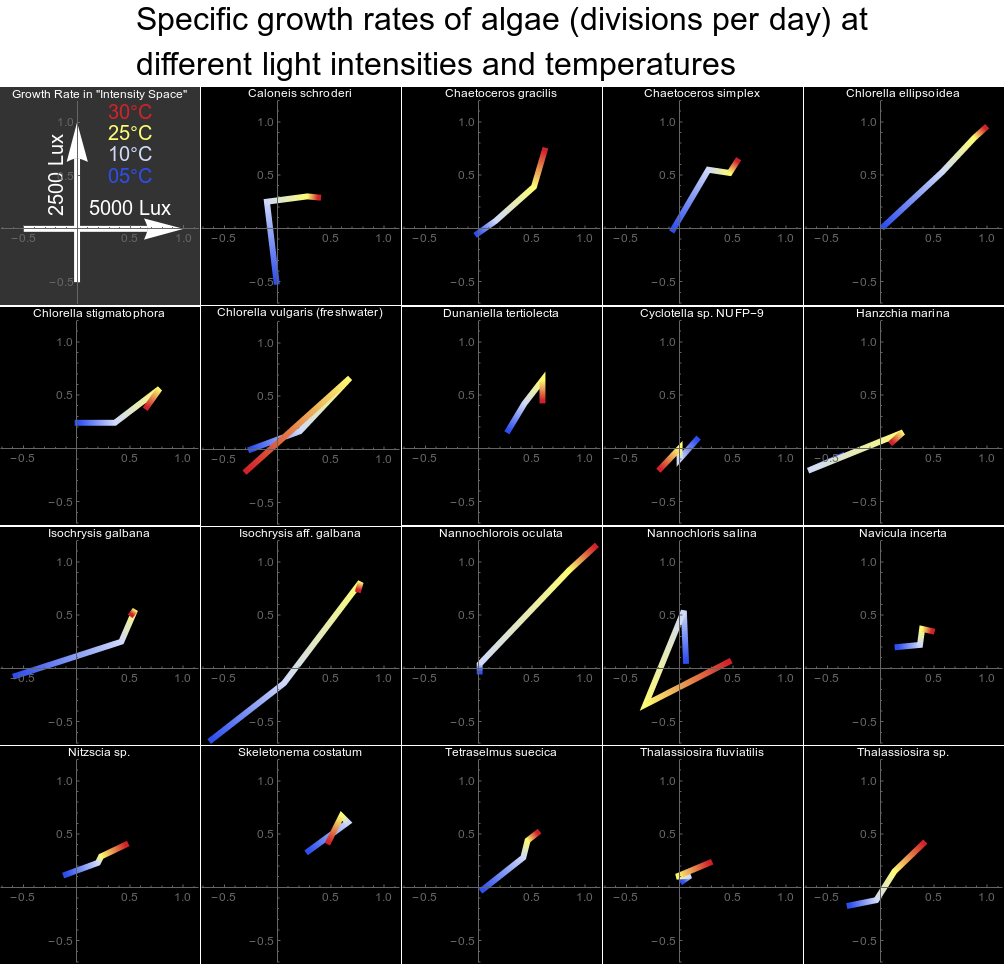
This is a response to the [CALL] Reddit DataViz Battle JAN2018: Visualize the Growth Rates of Algae:
http://community.wolfram.com/groups/-/m/t/1257547
Details
My simple idea is to visualize the data in the space of light intensity, where the temperature is color encoded. Here is my code:
(* data import according to Vitaliy Kaurov: *)

raw = Import["http://aquatext.com/tables/algaegrwth.htm", "Data"] /.
   "0..06" -> .06;
data = Cases[data, {_String, __?NumberQ}, Infinity] /.
   x_List /; First[x] == "Temperature" :> {"Temperature", 5, 5, 10,
     10, 25, 25, 30, 30};

colors = ColorData["TemperatureMap"] /@ {0, .33, .66, 1};
data0 = First[#] -> Partition[Rest[#], 2] & /@ data[[3 ;;]];
cb = 1.05 CoordinateBounds[Flatten[data0[[All, 2]], 1]];
imgSize = 200;
legend = Graphics[{Style[Text["05\[Degree]C", {0.5, 0.5}], 18,
     colors[[1]]],
    Style[Text["10\[Degree]C", {0.5, 0.7}], 18, colors[[2]]],
    Style[Text["25\[Degree]C", {0.5, 0.9}], 18, colors[[3]]],
    Style[Text["30\[Degree]C", {0.5, 1.1}], 18, colors[[4]]],
    Style[Text["5000 Lux", {0.5, 0.2}], 18, White],
    Rotate[Style[Text["2500 Lux", {-0.2, 0.5}], 18, White],
     90 \[Degree]], Thickness[.03], White, Arrowheads[.2],
    Arrow[{{0, -.5}, {0, 1}}], Arrow[{{-.5, 0}, {1, 0}}]},
   Axes -> True, Background -> GrayLevel[.2],
   PlotLabel ->
    Style["Growth Rate in \"Intensity Space\"", 10, White],
   PlotRange -> cb, ImageSize -> imgSize];
gr = Join[{legend}, (Graphics[{Thickness[.03],
        Line[#2, VertexColors -> colors]}, Axes -> True,
       Background -> Black, PlotLabel -> Style[#1, 10, White],
       PlotRange -> cb, ImageSize -> imgSize] & @@@ data0)];

grid = Labeled[Grid[Partition[gr, 5], Spacings -> {.1, .1}],
  Text@Style[
    "Specific growth rates of algae (divisions per day) at\ndifferent \
light intensities and temperatures", 30], Top]

Export["grid.png", grid]