In my previous post GraphImage2List(1,2) I created the tool that changes graph-image-data to numeric data(list data) in order to do a Machine Learning using graph-image-data. However, I have to set values(x&y coordinate) of some points in the image manually. So I create a new tool by TextRecognize to avoid this boring manual work.
Goal
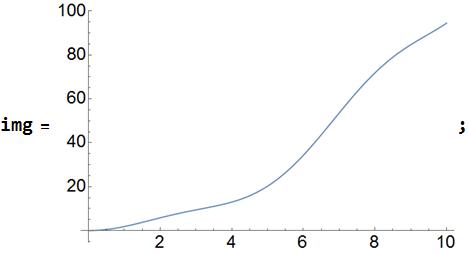
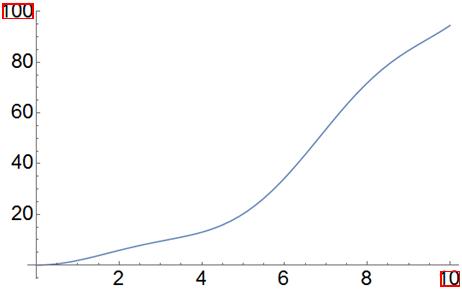
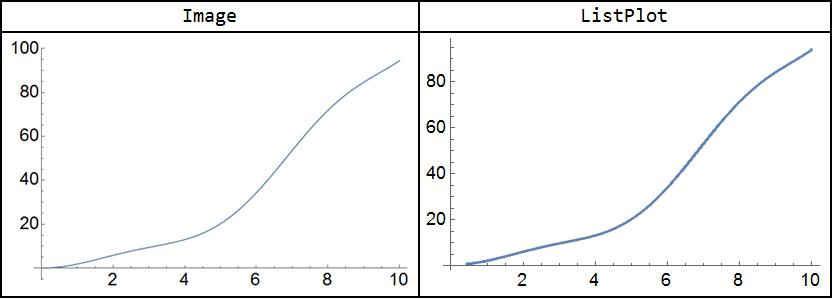
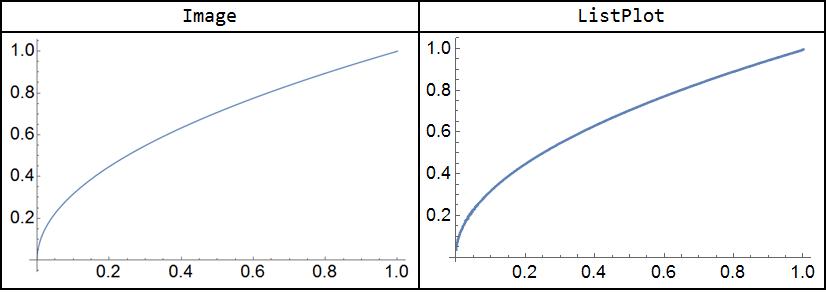
The left is the original graph (image data). The right is the graph (ListPlot) created automatically from the left image by the new tool. 
Get origin
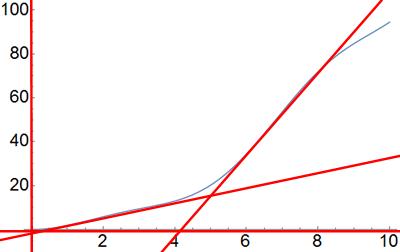
Get lines in the image by EdgeDetect and ImageLines. (It may be necessary to adjust parameters depending on the image.)
lines = ImageLines[EdgeDetect[img, 1], 0.2];
HighlightImage[img, lines]
Select x-axis and y-axis from lines.
axisX = Select[lines, Abs[#[[1, 1, 2]] - #[[1, 2, 2]]] < 1 &]
axisY = Select[lines, Abs[#[[1, 1, 1]] - #[[1, 2, 1]]] < 1 &]
{Line[{{0., 29.3551}, {540., 29.3551}}]}, {Line[{{0., 29.3551}, {540., 29.3551}}]}
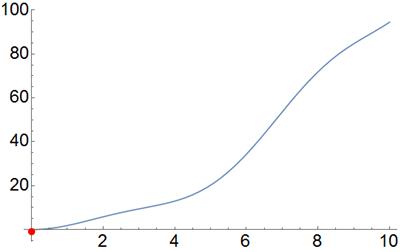
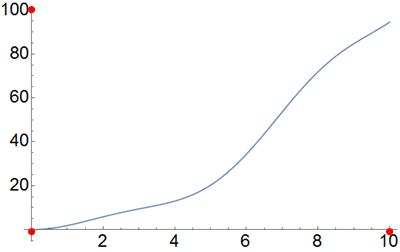
Get the pixel value of the origin.
{OX, OY} = {axisY[[1, 1, 1, 1]], axisX[[1, 1, 1, 2]]};
HighlightImage[img, Point[{OX, OY}]]
Get scales
Get the top value and position of x-axis scale and the rightmost value and position of y-axis scale.
{scaleY, scaleX} =
 ToExpression /@
  TextRecognize[img, "Block", Language -> "English"][[{1, -1}]]
rect = TextRecognize[img, "Block", "BoundingBox", Language -> "English"][[{1, -1}]]
HighlightImage[img, {"Boundary", rect}]
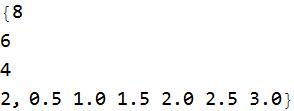
{100, 10}
{Rectangle[{3, 320}, {38, 337}], Rectangle[{515, 7}, {537, 24}]}
Get the top pixel value of x-axis scale and the rightmost pixel value of y-axis scale by the center of above rectangles and the origin.
scaleposX = {RegionCentroid[rect[[2]]][[1]], OY};
scaleposY = {OX, RegionCentroid[rect[[1]]][[2]]};
HighlightImage[img, {"Boundary", {scaleposX, scaleposY, {OX, OY}}}]
Get curve
Get the color of the curve in the image. (It may be necessary to adjust parameters depending on the image.)
DominantColors[img, ColorCoverage -> 0, MinColorDistance -> .25]

The second is closest to the color of the curve.
curvecolor =
 DominantColors[img, ColorCoverage -> 0, MinColorDistance -> .25][[2]]

Get the pixel value of the curve. (It may be necessary to adjust parameters depending on the image.)
points = PixelValuePositions[img, curvecolor, .075];
Get list
Based on the above, convert the pixel values of the curve to the coordinates.
convert[{x_, y_}] := {(x - OX)*scaleX/(scaleposX[[1]] - OX), (y - OY)*scaleY/(scaleposY[[2]] - OY)};
list = convert /@ points;
Grid[{{"Image", "ListPlot"}, {img,
       ListPlot[list, Joined -> True, PlotStyle -> PointSize[0.0025],
        LabelStyle -> Directive[Black, 12]]}}, Frame -> All]
Integrate
The above is integrated.
GetList3[img_] :=
 Module[{lines, axisX, axisY, OX, OY, scaleX, scaleY, rect, scaleposX,
    scaleposY, curvecolor, points},
  lines = ImageLines[EdgeDetect[img, 1], 0.2] ; (* adjust if necessary *)
  axisX = Select[lines, Abs[#[[1, 1, 2]] - #[[1, 2, 2]]] < 1 &];
  axisY = Select[lines, Abs[#[[1, 1, 1]] - #[[1, 2, 1]]] < 1 &];
  {OX, OY} = {axisY[[1, 1, 1, 1]], axisX[[1, 1, 1, 2]]};

  {scaleY, scaleX} = ToExpression /@
    TextRecognize[img, "Block", Language -> "English"][[{1, -1}]];
  rect = TextRecognize[img, "Block", "BoundingBox",
     Language -> "English"][[{1, -1}]];
  scaleposX = {RegionCentroid[rect[[2]]][[1]], OY};
  scaleposY = {OX, RegionCentroid[rect[[1]]][[2]]};
  curvecolor =
   DominantColors[img, ColorCoverage -> 0, MinColorDistance -> .25][[2]];
  (* adjust if necessary *)

  convert[{x_, y_}] := {(x - OX)*scaleX/(scaleposX[[1]] - OX),
     (y - OY)*scaleY/(scaleposY[[2]] - OY)};
  points = PixelValuePositions[img, curvecolor, .075]; (* adjust if necessary *)
  convert /@ points
  ]
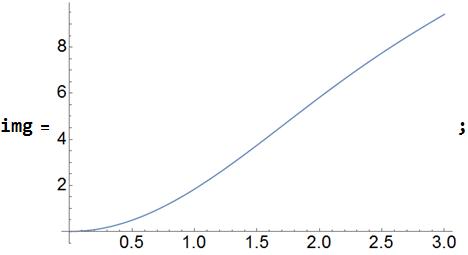
Another example:
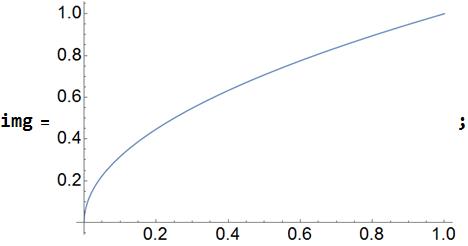
list = GetList3[img];
Grid[{{"Image", "ListPlot"}, {img,
   ListPlot[list, Joined -> True, PlotStyle -> PointSize[0.0025],
    LabelStyle -> Directive[Black, 12]]}}, Frame -> All]
Finally
I created the new tool that automatically changes graph-image-data to numeric data(list data). However, there is one problem. That is the recognition of scales of both axes by TextRecognize. Although it can recognize their positions in these examples, there are cases in which it is not possible to recognize in the similar figure. I cannot solve this problem. Any ideas very welcome.
TextRecognize can recognize only scales of x-axis.
rect = TextRecognize[img, "Block", "BoundingBox", Language -> "English"];
HighlightImage[img, {"Boundary", rect}]
Then try using Masking option of TextRecognize. First make a mask.
{imagex, imagey} = ImageDimensions[img];
lines = ImageLines[EdgeDetect[img, 1], 0.2] ;
axisX = Select[lines, Abs[#[[1, 1, 2]] - #[[1, 2, 2]]] < 1 &];
axisY = Select[lines, Abs[#[[1, 1, 1]] - #[[1, 2, 1]]] < 1 &];
{OX, OY} = {axisY[[1, 1, 1, 1]], axisX[[1, 1, 1, 2]]};
mask = HighlightImage[
   img, {Opacity[1], White, Rectangle[{OX + 2, 0}, {imagex, OY - 1}],
    Rectangle[{0, OY + 2}, {OX - 1, imagey}]}, {"Remove", Black}];
mask = mask // Rasterize

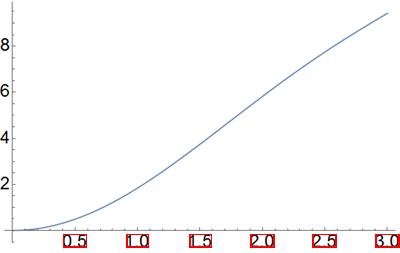
TextRecognize can recognize all the scales of both axes, but it cannot recognize each position(rectangle).
TextRecognize[img, RecognitionPrior -> "Block", Language -> "English", Masking -> mask]
rect = TextRecognize[img, "Block", "BoundingBox", Language -> "English", Masking -> mask];
HighlightImage[img, {"Boundary", rect}]