 !
!
Correlations
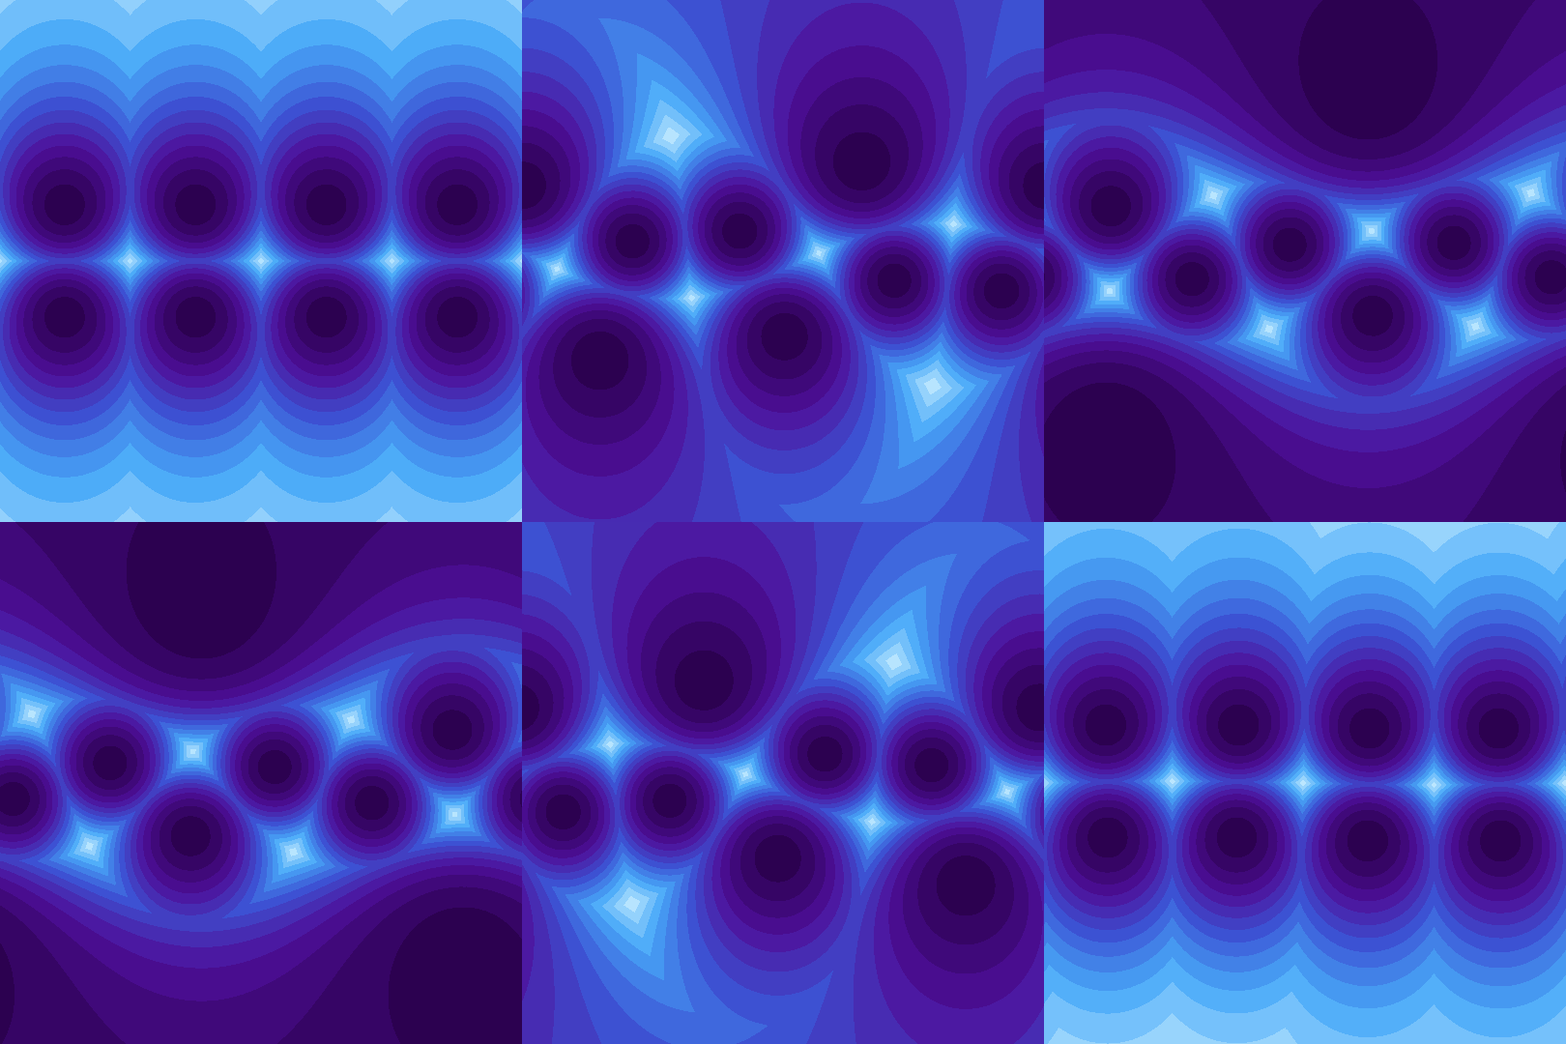
As with Map and In Balance, this is showing the Mercator projection of some phenomenon happening on the sphere.
In this case, what I'm doing is plotting level sets of a function which computes the sum of the absolute values of the dot products of a given point on the sphere with the vertices of the regular octahedron, namely the points $(1,0,0),(-1,0,0),(0,1,0),(0,-1,0),(0,0,1),(0,0,-1)$. Or rather, to make the animation, I'm doing this after rotating the vertices of the octahedron around the axis $(1,0,1)$, which passes through the center of one of the edges of the octahedron. The maximum value $2\sqrt{3}\approx 3.46$ of this function is achieved at the centers of the faces of the octahedron, which correspond to the black points in the animation, and the minimum value $2$ is achieved at the vertices of the octrahedron, corresponding to the light points.
To define this as a function on the plane, I need to use the inverse of the Mercator projection, which is
InverseMercator[{x_, y_}] := {Sech[y] Cos[x], Sech[y] Sin[x], Tanh[y]};
So now in principle I should just be able to take the sum of Abs[InverseMercator[{x,y}].p] where p ranges over the rotated vertices of the octahedron and plug this into ContourPlot[]. Unfortunately, this turns out to be quite slow, so instead I am going to precompute what this will be as a function of $x$, $y$, and $\theta$ (the rotation angle), which boils down to evaluating
FullSimplify[
 Total[
  Abs /@
   (InverseMercator[{x, y}].RotationTransform[θ, {1, 0, 1}][#]
      & /@ Flatten[Permutations[# {0, 0, 1}] & /@ {1, -1}, 1])],
 -π < x < π && -π < y < π && 0 < θ < 2 π]
Now, the output of the above is
Abs[Sech[y] (Cos[x] (1 + Cos[θ]) + Sqrt[2] Sin[x] Sin[θ]) + Tanh[y] - Cos[θ] Tanh[y]]
+ Abs[Sech[y] (Cos[x] - Cos[x] Cos[θ] - Sqrt[2] Sin[x] Sin[θ]) + (1 + Cos[θ]) Tanh[y]]
+ Abs[2 Cos[θ] Sech[y] Sin[x] + Sqrt[2] Sin[θ] (-Cos[x] Sech[y] + Tanh[y])]
so this is what I actually plug into ContourPlot[]:
Manipulate[
 ContourPlot[
  Abs[Sech[y] (Cos[x] (1 + Cos[θ]) + Sqrt[2] Sin[x] Sin[θ]) + Tanh[y] - Cos[θ] Tanh[y]]
   + Abs[Sech[y] (Cos[x] - Cos[x] Cos[θ] - Sqrt[2] Sin[x] Sin[θ]) + (1 + Cos[θ]) Tanh[y]]
   + Abs[2 Cos[θ] Sech[y] Sin[x] + Sqrt[2] Sin[θ] (-Cos[x] Sech[y] + Tanh[y])],
  {x, -π, π}, {y, -π, π},
  Frame -> False, ImageSize -> 540, Contours -> Range[2, 4, .1],
  ContourStyle -> None, PlotRangePadding -> -0.01, PlotPoints -> 50,
  ColorFunction -> (ColorData["DeepSeaColors"][1 - #] &)],
 {θ, 0, π}]