Visualization of the Sardex Network
1. Introduction
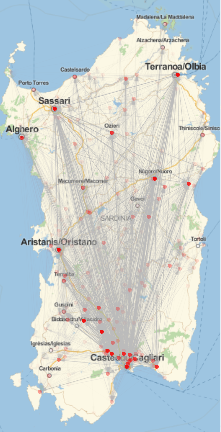
Sardinia, is an island off the southern coast of Italy (rimmed in blue in the picture below). Following the global financial crisis and the euro meltdown of 2008/09, a group of social activists launched a complementary currency to deal with the long lived European recession. A new exchange was created to facilitate the exchange of goods without using Euros, which were scarce.
For example, when a business without euros or a liberal bank credit line wishes to trade for goods or services, it can instead use Sardex. As a member of the Sardex exchange, the buyer would purchase goods through Sardex debits in their account. The seller would sell goods and get Sardex credits in their account. This operates the same way as money as there is no interest paid or received. All businesses that are members are issued a credit line by Sardex which is limited to 1/9 of their total sales for the year. This puts a limit on total debits.
The sardex exchange does not convert Sardex for Euros. This means that any credit lines that are created in the system are free to use. It also means that creditors have an interest in spending their credits rather than holding onto them, increasing the velocity of money. Because it is a closed network, this local community currency is a solution to what many peripheral economies face when dealing with a national currency.
The Sardex community currency, or mutual credit network, is meant to complement rather than replace the use of Euros. However it solves the lack of effective demand that typically exists when local banks lend externally, or net imports are high. Launched in 2010, it has been lauded as extremely successful in bringing spare capacity back into economic production.
sardinia =
  MapAt[#1[[2]] &,
   EntityValue[Entity["Country", "Italy"],
    EntityProperty["Country", "Polygon"]], {1, 1}];
GeoGraphics[{{EdgeForm[Black], FaceForm[Red],
   Polygon[Entity["Country", "Italy"]]}, {EdgeForm[Blue],
   FaceForm[Blue], sardinia}}]
Project Goal
The goal of this project is to study the sardex trade network. Our first task was to clean the data such that it was suitable for Mathematica. Sardex Exchange, this project will create a friendly database environment to study network liquidity and its evolution. The goal is to understand how a complementary currency can increase economic prosperity in a community.After cleaning the data, a network graph was plotted onto the map of Sardinia, showing the trade relationships between businesses and employees. The network data was used to describe and visualized both stocks and flows of Sardex accounts.
2. Data
The Sardex data was provided by Giuseppe Littera, one of the key founders of the Sardex exchange. This data is proprietary and not available to the general public. All accounts were anonymized before using the data.
Datasets are represented in this notebook as three files: - Balances of Member Accounts - "balances" - Transactions between Members - "transDat" - -Member profiles such as type of member and city of residence - "memberDat"
The Dataset had 2719 members, over the period from February 2013 to September 2014. Membership grew over the period, although some members did leave (were removed) during the period.
3. Geo Query
To create a network that located each vertex to a latitude and longitude, the coordinates had to be found In searching for approximately 300 cities of residence in Mathematica, we found that only 200 were available. Instead of this we downloaded geo data from the following website.
Using Mathematica code we downloaded the lat long from this data base : https : // opencagedata.com/demo
The query below had one answer half the time, and the other half anywhere from 2 to 4 answers. We took the first answer, with limited perusal of the data. A more thorough consistency check is required to ensure that the correct address has been chosen, and that the spelling errors in the data set are not causing some issues.
geoCode[location_String]:=Module[{page},
page=Import["https://api.opencagedata.com/geocode/v1/json?q="<>URLEncode[location]<>"&key=060caebd1286461ab35b157626d66b45","JSON"];
location->({Last/@#[[1]],#[[2]]}&/@({"geometry","formatted"}/.#&/@("results"/.page)))
]
Save the entire list of geo results (multiple geo {lat,lng} answers to one city) to the file. Future work will entail a more thorough examination of our choice given city and province information.
4. Building the Network
a. Find unique bilateral directed edges and aggregate
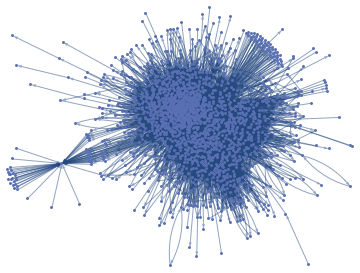
There are 59, 623 directed links going from buyers to sellers. This is the direction of money or more specifically credit. We reduced this number of links, which occur over time, to one aggregated time period. During the 20 months from February 2013 to September 2014 the network component had 2, 717 firms and employees using the currency (credit) supporting 16, 390 trading relationships.
setOfBilateral=Map[
{#IDBuyer \[DirectedEdge] #IDSeller ,#Amount}&,
transDat];
setOfBilateral=Map[ {#IDBuyer [DirectedEdge] #IDSeller ,#Amount}&, transDat]//Length 59623 uniquelinks=Query[GroupBy[First],Total,2] @ setOfBilateral; weightedEdge=Dataset@KeyValueMap[<|"Edge"->#1,"Amount"->#2|>&,Normal@uniquelinks]//Length
b. Build the graph (internal structure)
Purchase Network, Direction of Edge "follows the Money"
dirEdges=Normal@weightedEdge[[All,"Edge"]]
c. Make a GeoPosition hash table to map from id to GeoLocation
Lat.Long of the city that the firm or employee resides.
geoPositionTable=Association[Apply[#1->{#3,#2}&]@*Values/@Normal[memberDat[All,{"ID","lon","lat"}]]]
geoPositions = DeleteMissing /@ (Values@geoPositionTable)
d. Map GeoLocation to GeoPath for visualization by using edges information
Since I know the GeoPosition of each vertex, we can make an association that takes the list of edges, and convert it into a list of GeoPath, and plot with GeoGraphics.
convertGraphEdgeToMapEdge[edge_]:= {geoPositionTable[edge[[1]]], geoPositionTable[edge[[2]]]}
geoPaths = convertGraphEdgeToMapEdge /@ dirEdges;
GeoGraphics[{Opacity[0.028], Lighter@Gray, Arrowheads[.03],
  Arrow@GeoPath[geoPaths, "Geodesic"], Red, PointSize[0.02],
  Point /@ (GeoPosition /@ geoPositions)}, ImageSize -> Medium]
This gives us the picture at the top of this post.
4. Balances over Time
After cleaning the balance data sheet, I create a time series of monthly member balances at the Sardex exchange. The total number of members is 2487 which is a subset of the original number of member IDs 2717 (a number of members had missing balances an zero transactions over the period).
I will update this post with these results.
5. Conclusion
This post is just the beginning of a longer term study of the Sardex Exchange and its community currency project. Further work will consider how current members are embedded in the system, and whether their connections are growing over time; to what extent there is new membership, and the speed of their embedding. Spatial and temporal analysis could be investigated using spatial autocorrelation measures.
Acknowledgement
I would like to thank Guiseppe Littera and his colleagues at Sardex and LSE for letting me utilize and study this dataset.
References
Georgios Iosifidis, Yanick Charette, Giuseppe Littera, Leandros Tassiulas, and Nicholas Christakis, "Network Analysis of the SardexCommunity Currency" (September 23, 2015).Yale Day of Data.Paper 4. http://elischolar.library.yale.edu/dayofdata/2015/Posters/4
Sardex Exchange https : // sardex.net/


