Message Boards Message Boards

Which countries did @realDonaldTrump tweet about?

Introduction

A couple of days ago on 1 July The Economist tweeted this:

Since he was elected in 2016 Donald Trump has made 1,384 mentions of foreign countries on Twitter. Can you guess which one he named most often?

It claims that in spite of the "special relationship" with the UK, it is only ranked 15th of the countries and territories tweeted about. It also says that Puerto Rico, Mexico and China are in fifth, fourth and third places respectively (countries and territories). According to The Economist North Korea is ranked in second place with 163 mentions.

A couple of years ago I read the excellent book "A Mathematician Reads the Newspaper" by John Allen Paulos; and I wonder how much of the daily news coverage can we check using the Wolfram Language. In a future post I will speak about another project that we are doing with several members of this community that goes in a similar direction. We call it "computational conversations". With a bit of luck you might hear about it at the Wolfram Technology Conference later this year.

Initial analysis ----------

It turns out that I have been monitoring @realDonaldTrump's tweets using IFTTT since early 2017. I attach excel files to this post. To have a look at the first tweet we first set the directory and load the raw data files:

SetDirectory[NotebookDirectory[]]
dataraw = Import /@ FileNames["Trump*.xlsx"];

As the first file (without a number) will be read in last (alphabetical order), this is the first tweet data:

dataraw[[5, 1, 1]] // TableForm

enter image description here

It is from January 26th, 2017, a couple of days after his inauguration.

In oder to figure out which countries Mr Trump talks about we use the function TextCases, a recently updated function:

tweettexts = Join[dataraw[[1, 1]], dataraw[[2, 1]], dataraw[[3, 1]], dataraw[[4, 1]], dataraw[[5, 1]]][[All, 2]];

locations =  TextCases[StringJoin[tweettexts], "LocationEntity" -> "Interpretation", VerifyInterpretation -> True];

I find

Length@locations

5768 locations; these will not only include direct mentions of countries but also locations within countries. These locations will be in Entity-form:

locations[[1;;20]]

enter image description here

Let's get that apart. First we make a list of all countries in the world:

purecountries = # -> {#} & /@ EntityList[EntityClass["Country", "Countries"]];

If we select all direct mentions of countries we obtain:

Select[locations, MemberQ[purecountries[[All, 1]], #] &] // Length

3624 mentions; if we exclude the 1349 mentions the US, we are left with 2275 country names. Despite our list starting with later tweets we obtain substantially more mentions of countries than The Economist (1,384). We can now generate a table of the mentions of all countries:

TableForm[Flatten /@ Transpose[{Range[Length[#] - 1], Delete[#, 5]}] &@({#[[1]], #[[2]]} & /@ 
Normal[ReverseSort[Counts[CommonName@(Select[locations, MemberQ[purecountries[[All, 1]], #] &])]]])]

enter image description here

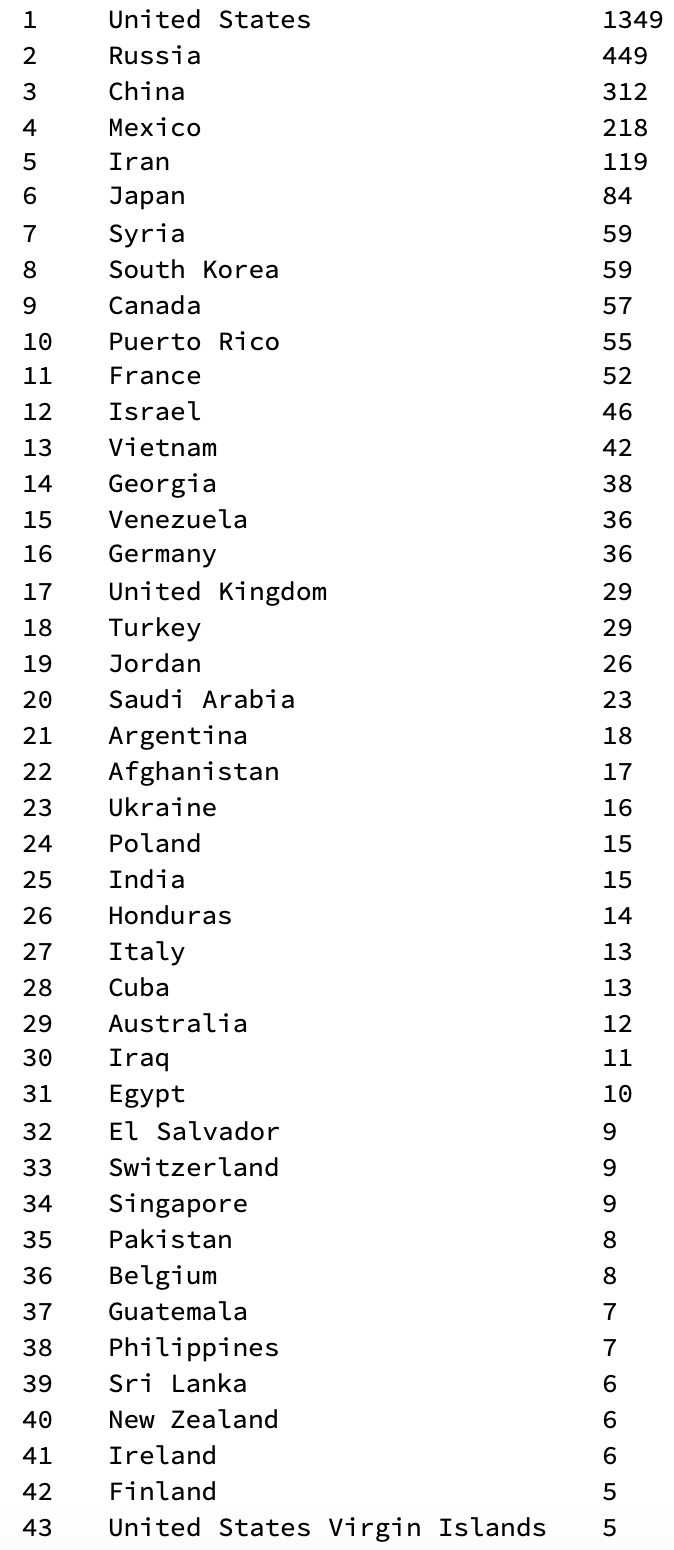
(This is only the top of the list.) Note, that North Korea is missing, but will be very prominent in the next table.... Next we can check for "indirect" mentions of a country, i.e. Louvre would lead to a mention of France etc. We will find many more entities and will first generate a list of substitution rules:

countriesrules = # -> Check[GeoIdentify["Country", #], {#}] & /@ (Complement[DeleteDuplicates[locations], EntityList[EntityClass["Country", "Countries"]]]);

We will ignore the error messages for now. We can then generate a table that includes the "indirect" mentions, too:

TableForm[Flatten /@ Transpose[{Range[Length[#] - 1], Delete[#, 5]}] &@({#[[1]], #[[2]]} & /@ 
 Normal[ReverseSort[Counts[CommonName@(DeleteMissing[Flatten[locations /. countriesrules]])]]])]

enter image description here

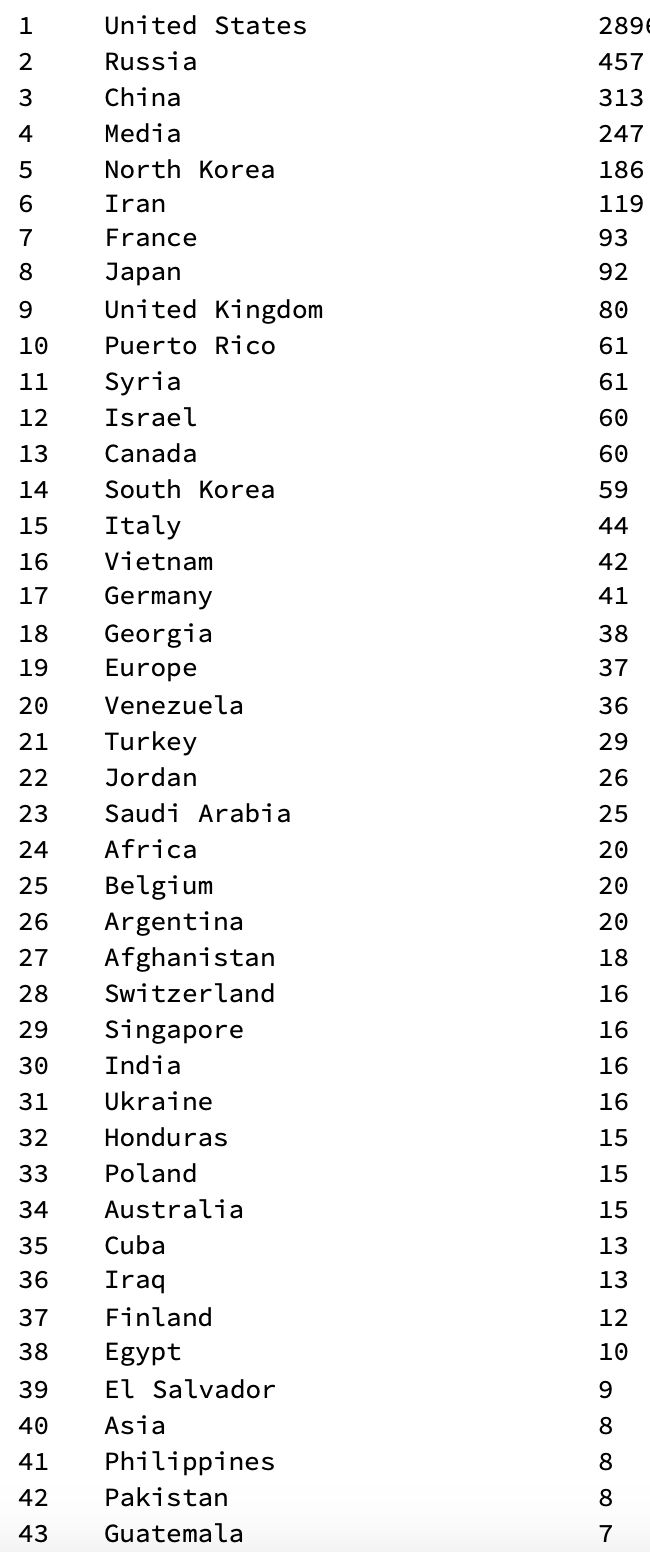
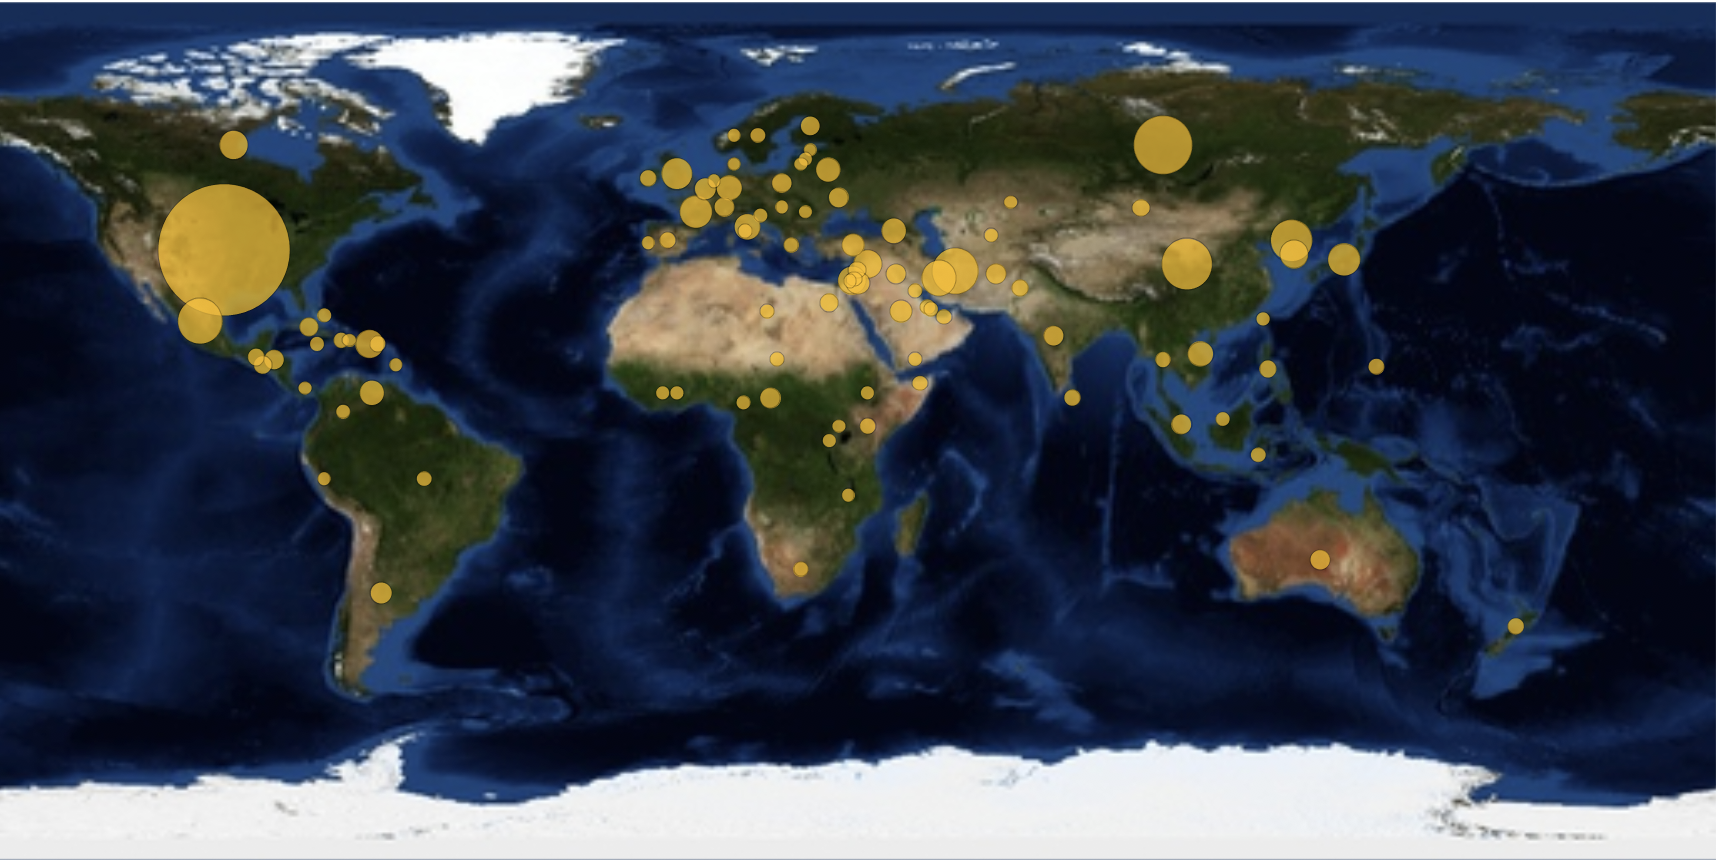
Note, that on rank 4 we find Media, which is not a country. It is easy to clean out, but I leave it in to show the performance of the code so far. We could now make typical representations such as GeoBubbleCharts:

GeoBubbleChart[Counts[DeleteMissing[Flatten[locations /. countriesrules]]], GeoBackground -> "Satellite"]

enter image description here

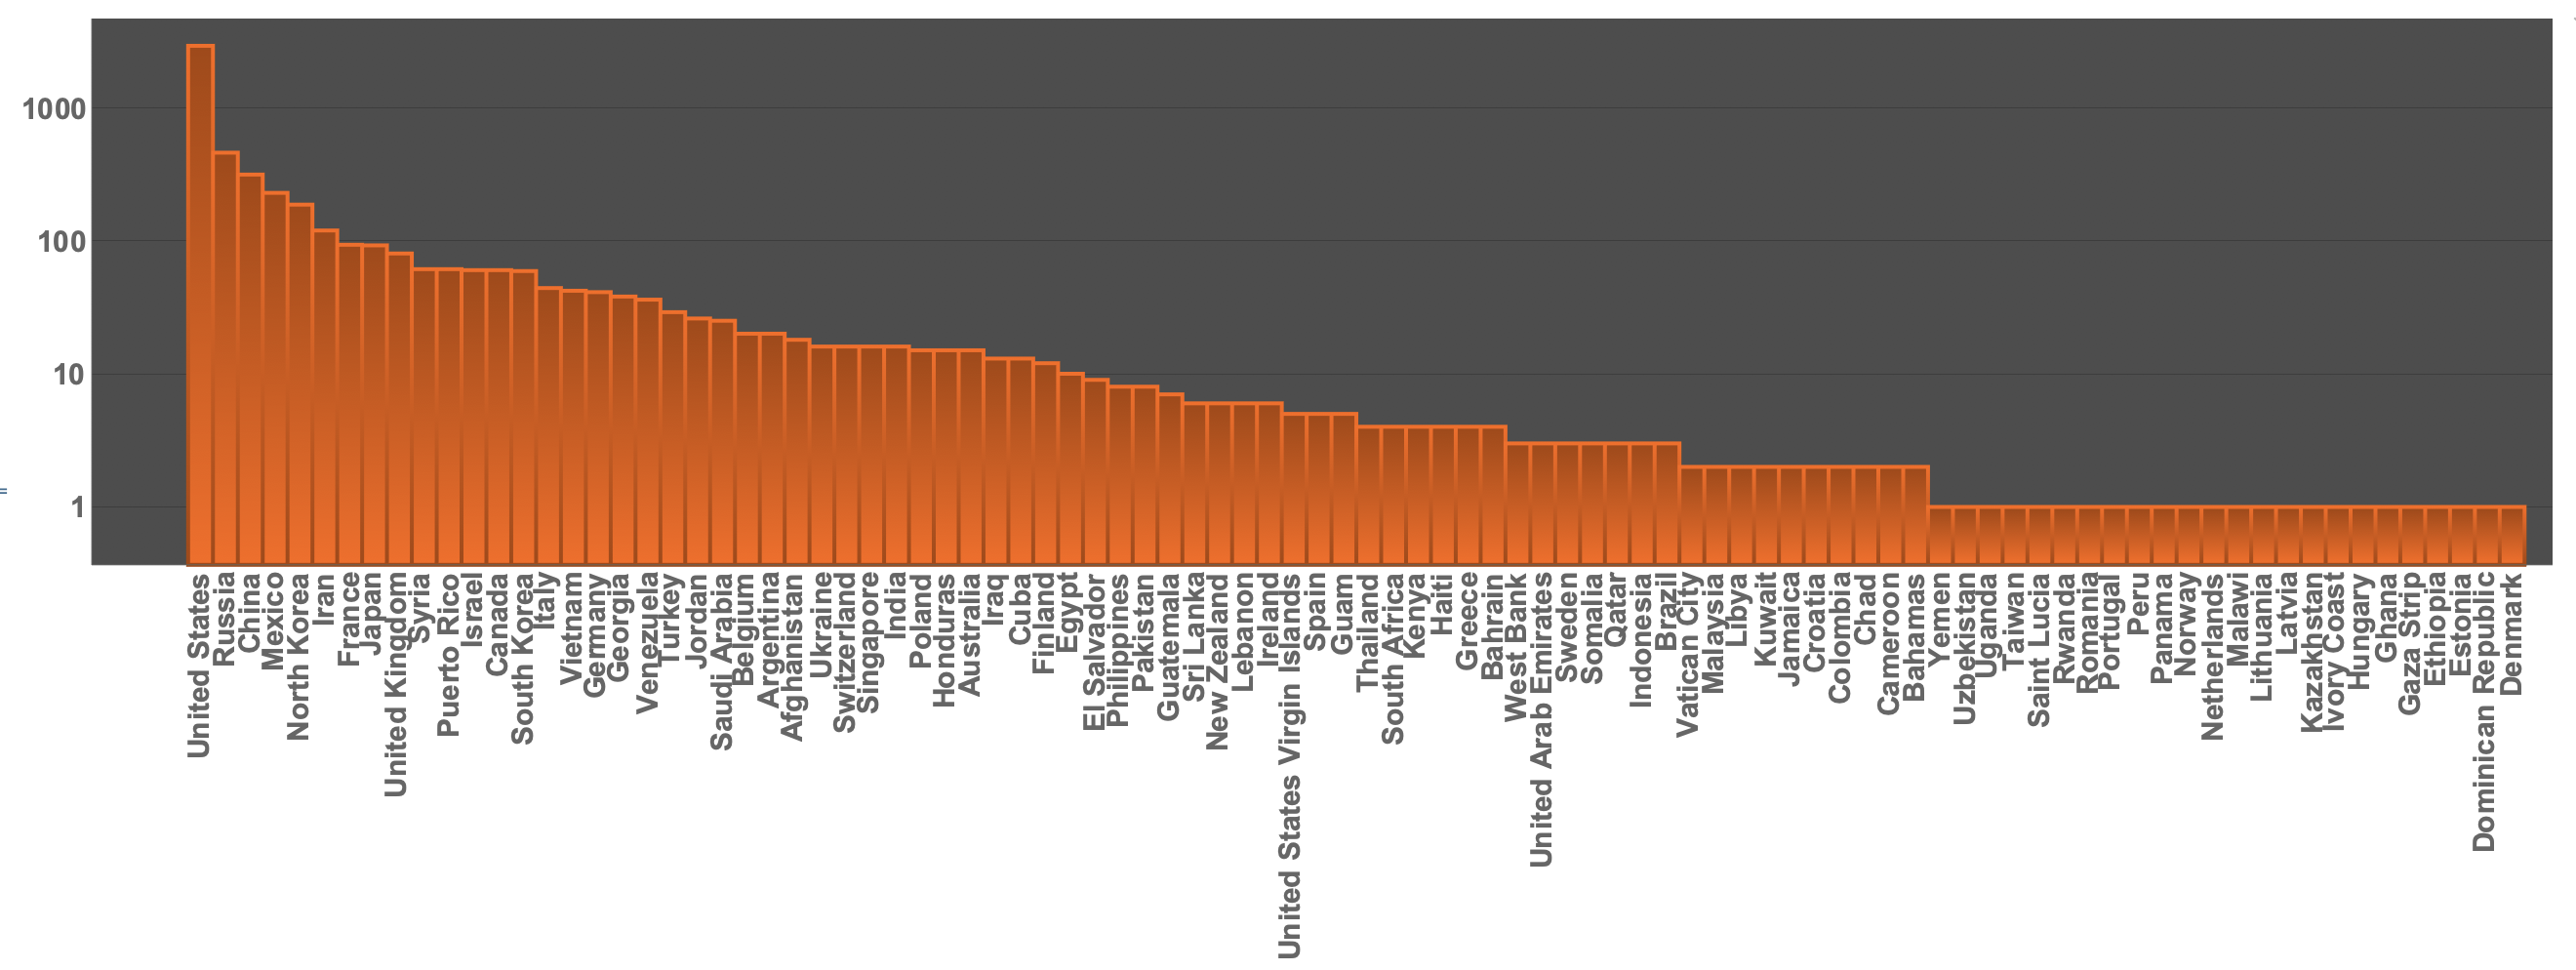
We can now make a BarChart (on a logarithmic scale) selecting "purecountries" like so:

BarChart[ReverseSort@<|
   Select[Normal@
     Counts[DeleteMissing[Flatten[locations /. countriesrules]]], 
    MemberQ[purecountries[[All, 1]], #[[1]]] &]|>, 
 ScalingFunctions -> "Log", 
 ChartLabels -> (Rotate[#, Pi/2] & /@ 
    CommonName[
     ReverseSortBy[
       Select[Normal@
         Counts[DeleteMissing[Flatten[locations /. countriesrules]]], 
        MemberQ[purecountries[[All, 1]], #[[1]]] &], Last][[All, 
       1]]]), PlotTheme -> "Marketing", 
 LabelStyle -> Directive[Bold, 15]]

enter image description here

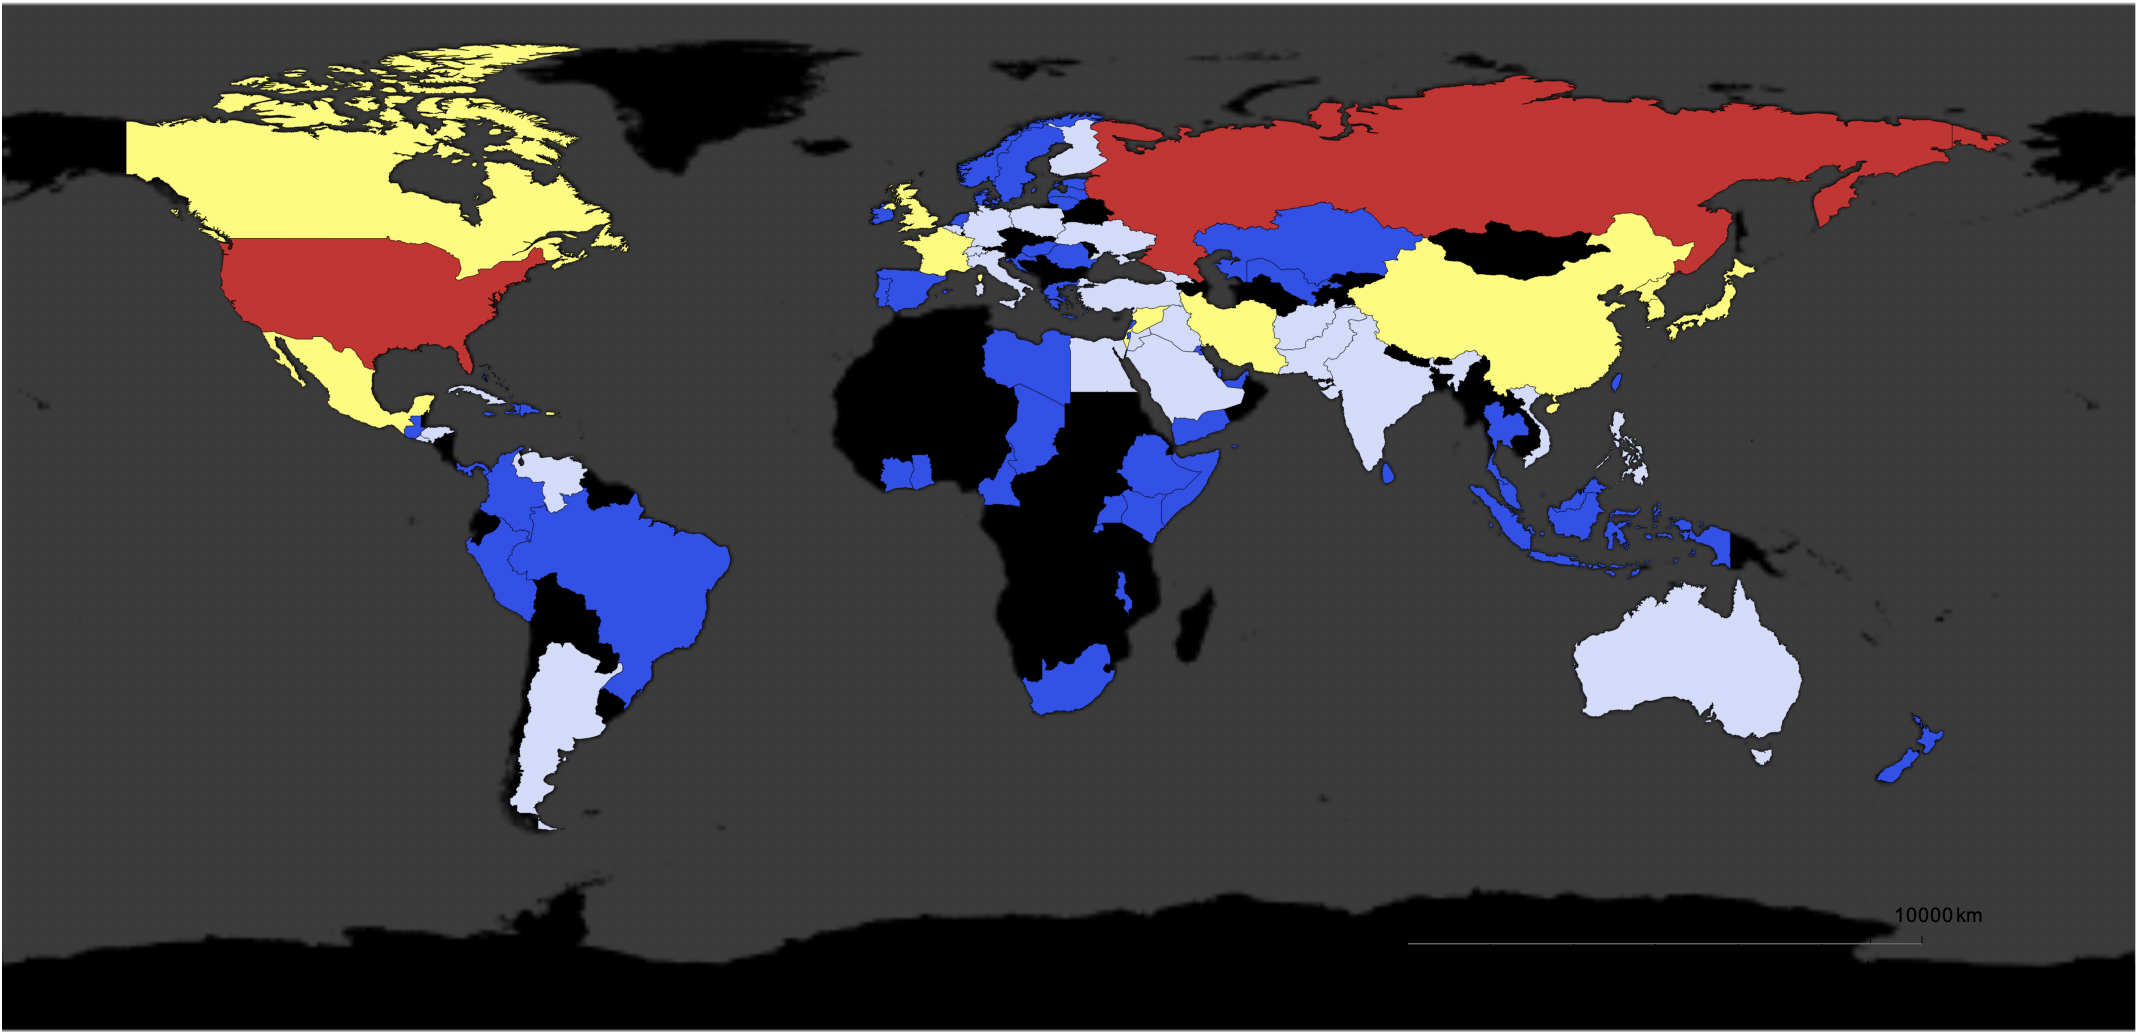
We can also represent that on a world wide map:

styling = {GeoBackground -> GeoStyling["StreetMapNoLabels", 
GeoStylingImageFunction -> (ImageAdjust@ColorNegate@ColorConvert[#1, "Grayscale"] &)], 
GeoScaleBar -> Placed[{"Metric", "Imperial"}, {Right, Bottom}], GeoRangePadding -> Full, ImageSize -> Large};

GeoRegionValuePlot[
Log@<|Select[Normal@Counts[DeleteMissing[Flatten[locations /. countriesrules]]], MemberQ[purecountries[[All, 1]], #[[1]]] &]|>, Join[styling, {ColorFunction -> "TemperatureMap"}]]

enter image description here

Further analysis

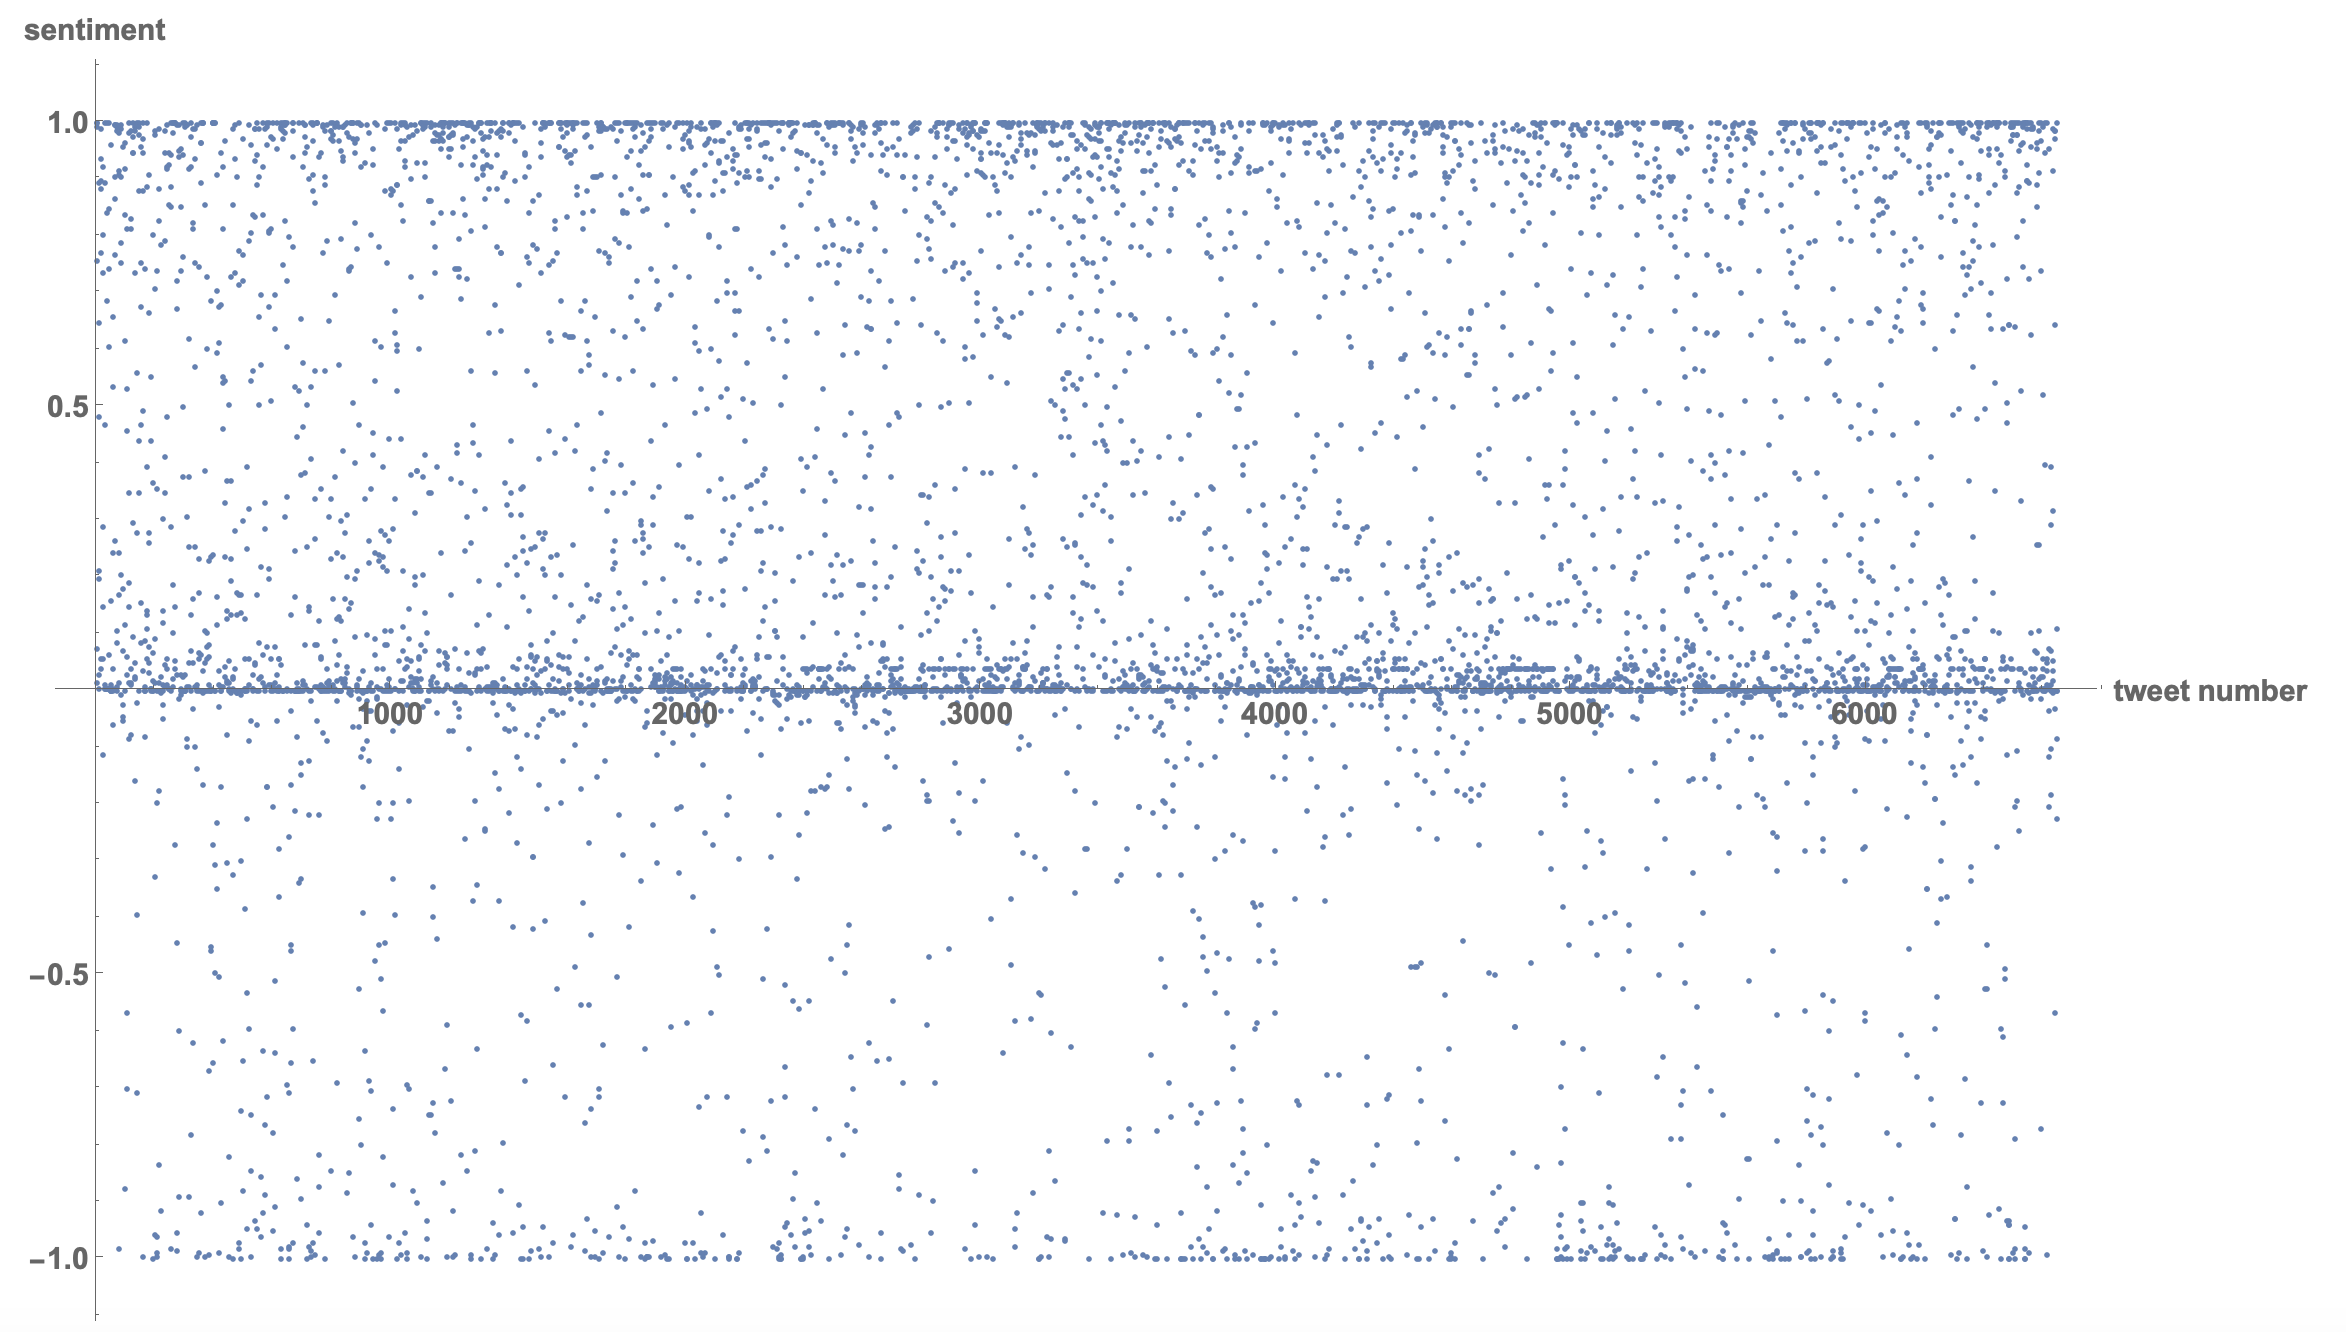
We can of course look at many other features of the tweets. One is a simple sentiment analysis. I am not at all convinced that the result of this attempt are useful or representing an actual pattern. But this is what we could do:

emotion[text_] := "Positive" - "Negative" /. Classify["Sentiment", text, "Probabilities"]

and then

tweetssentiments = emotion /@ tweettexts;
ListPlot[tweetssentiments, PlotRange -> All, LabelStyle -> 
 Directive[Bold, 15], AxesLabel -> {"tweet number", "sentiment"}]

enter image description here

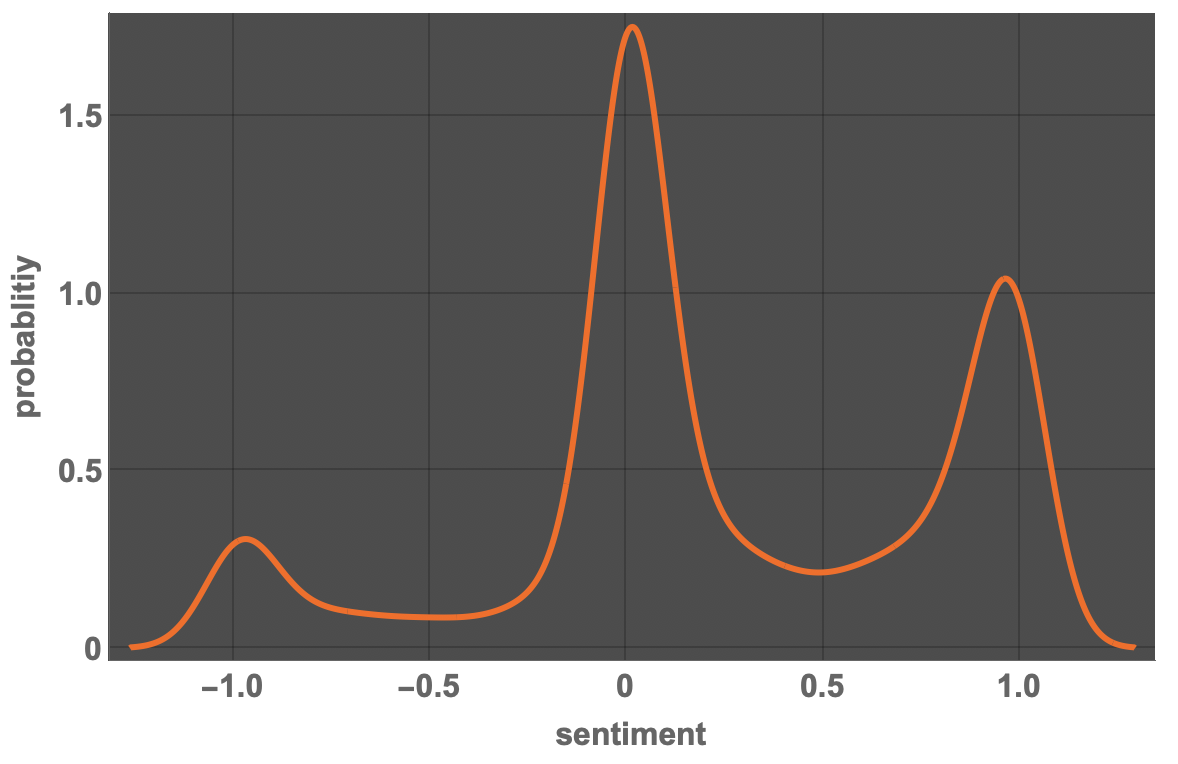
Using a SmoothHistogram, we see a pattern of "extremes", negative, neutral, positive:

SmoothHistogram[tweetssentiments, PlotTheme -> "Marketing", 
 FrameLabel -> {"sentiment", "probablitiy"}, 
 LabelStyle -> Directive[Bold, 16], ImageSize -> Large]

enter image description here

We can also ask for less relevant information, such as the colours mentioned in the tweets:

textcasesColor = TextCases[StringJoin[tweettexts], "Color" -> "Interpretation", VerifyInterpretation -> True]

enter image description here

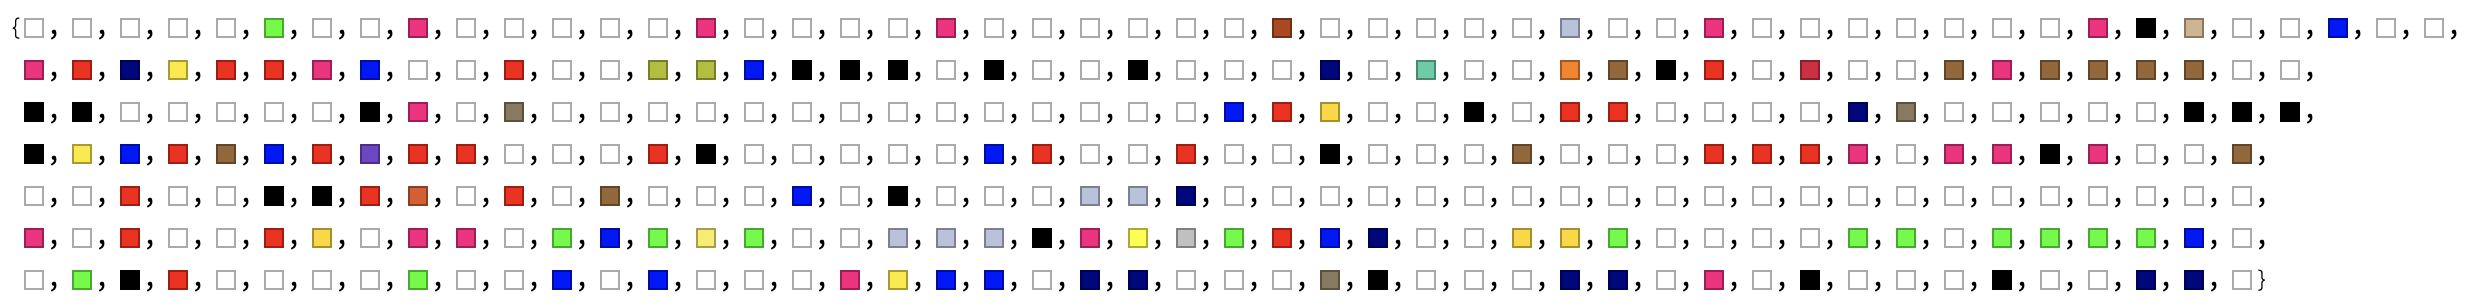
So there is a lot of white, some black, red and green:

ReverseSort@Counts[textcasesColor]

enter image description here

Let's blend these colours together:

Graphics[{Blend[textcasesColor], Disk[]}]

enter image description here

We can also look for "profanity" in tweets:

textcasesProfanity = TextCases[StringJoin[tweettexts], "Profanity"];

and represent these tweets in a table:

Column[textcasesProfanity, Frame -> All]

enter image description here

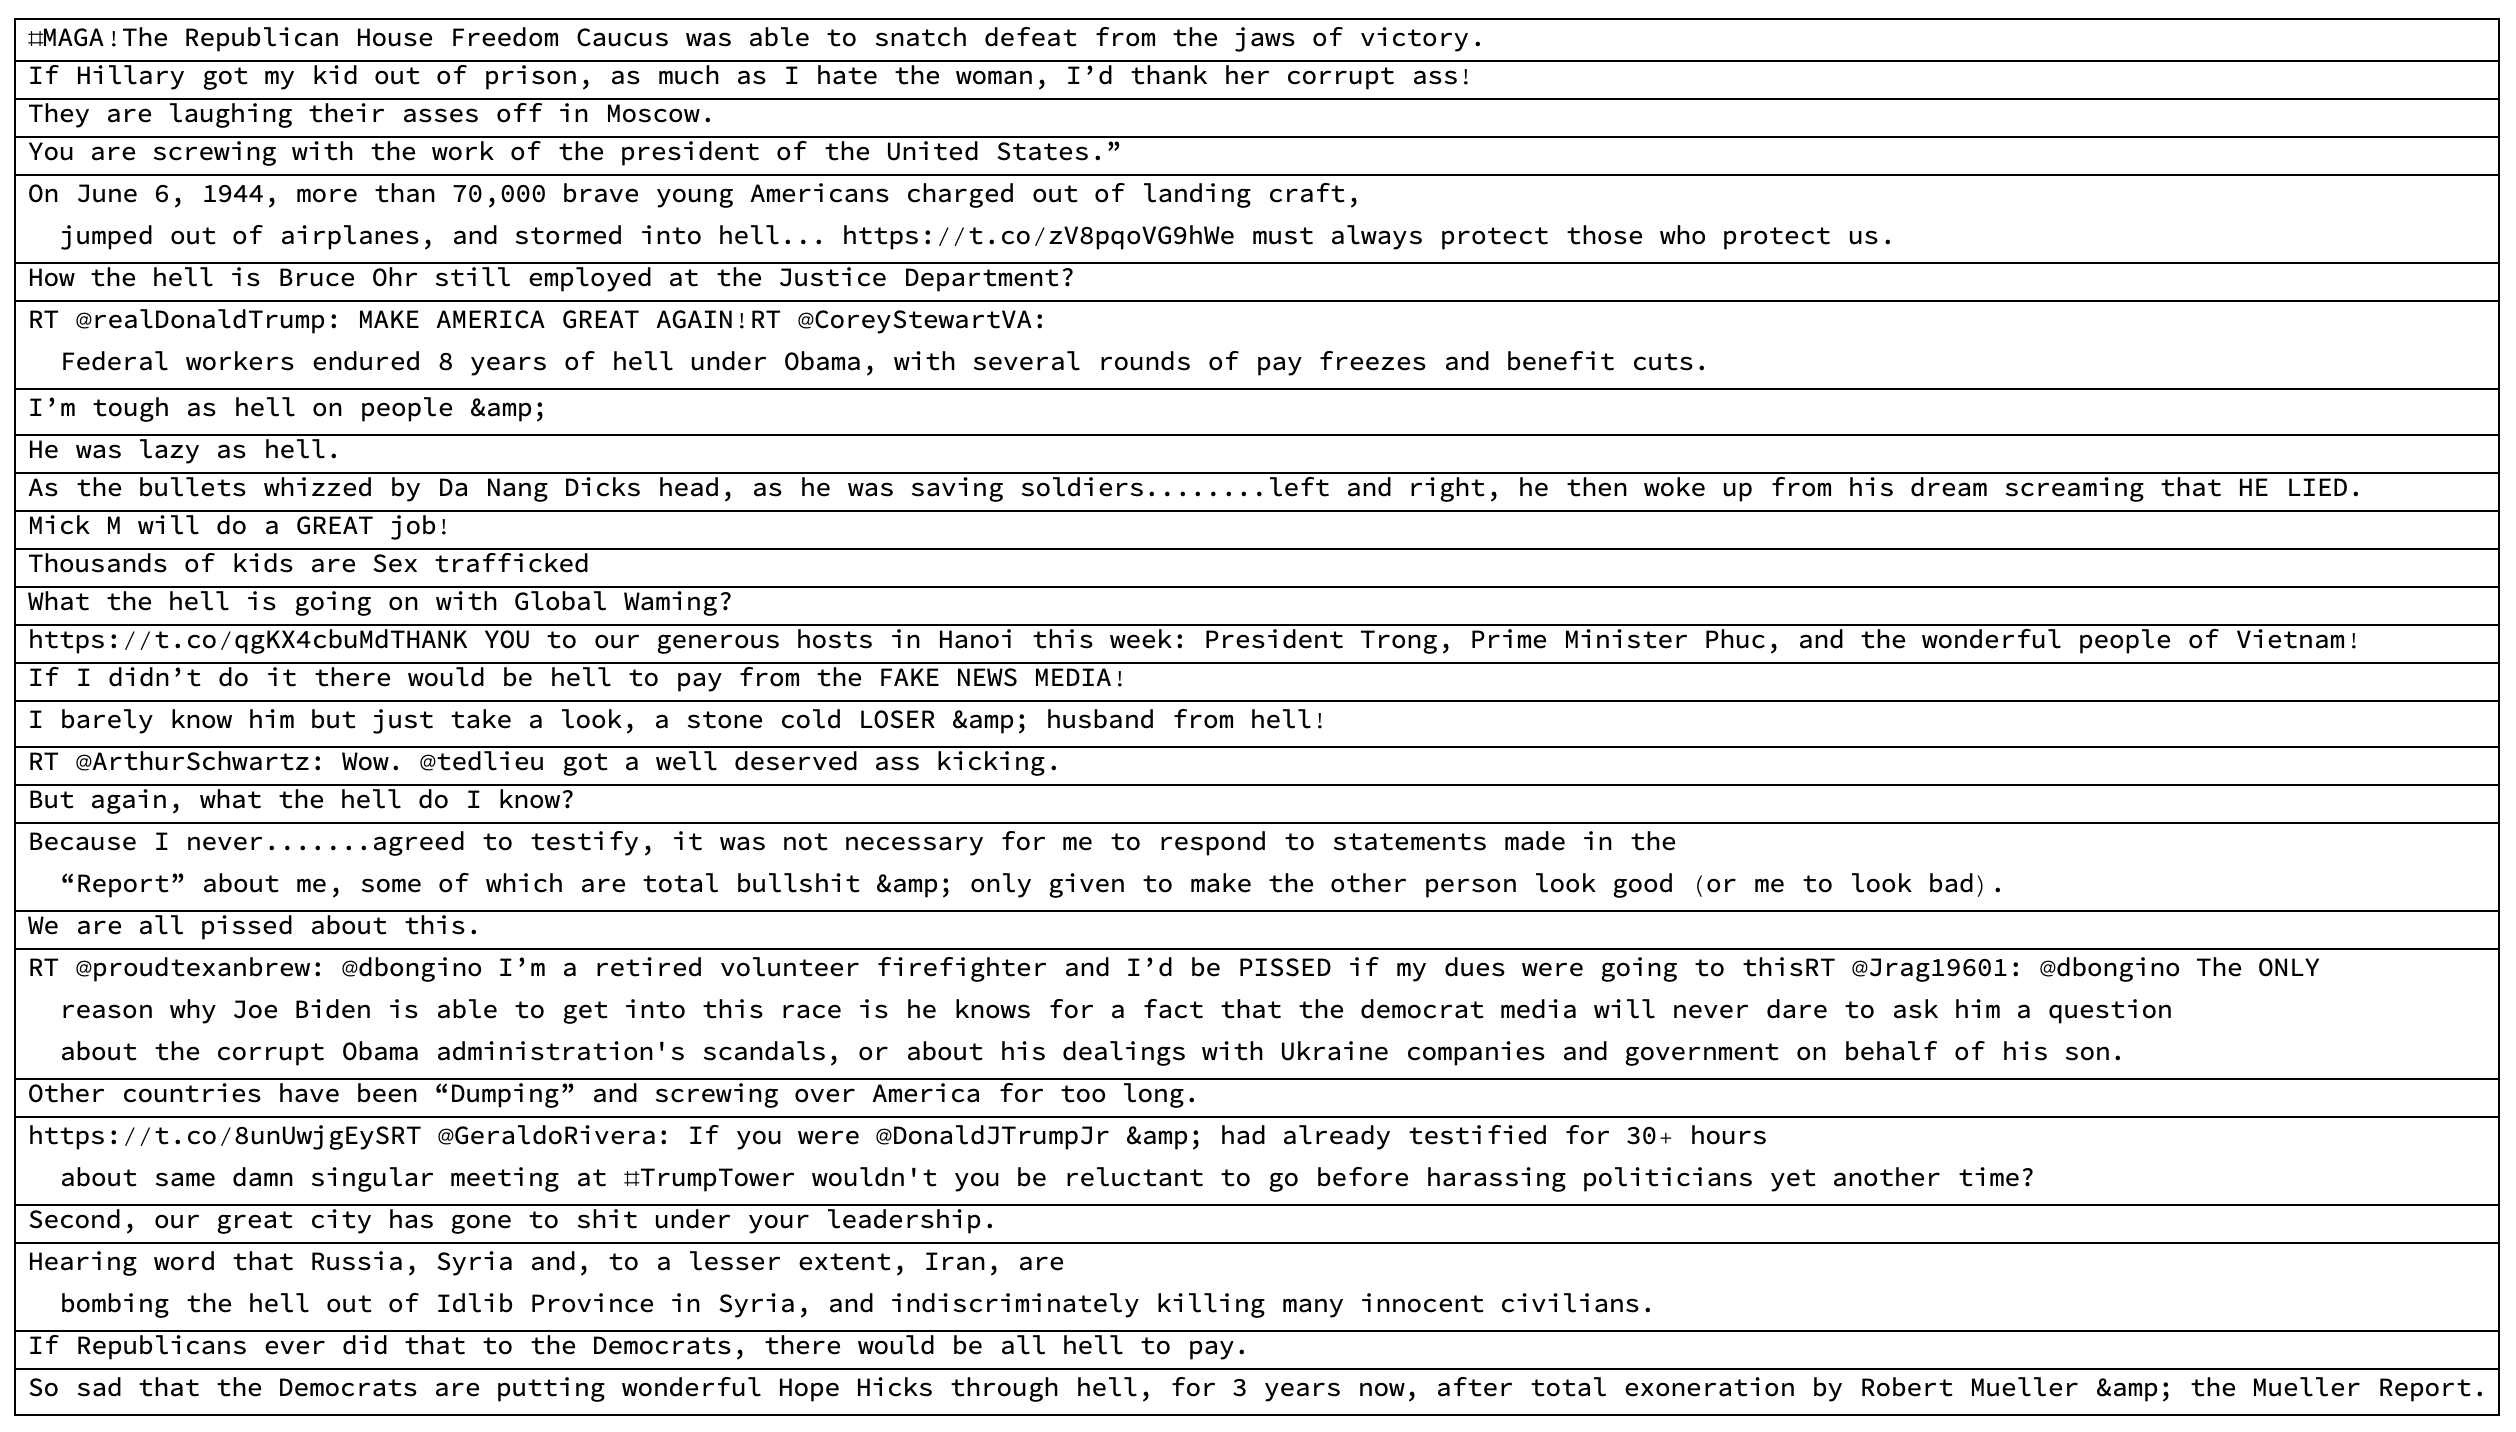
It is not quite clear to my why some of the tweets are classified as containing profanity. For some tweets it is relatively obvious, I think.

Twitter handles

Another interesting analysis is to look at the twitter handles that @realDonaldTrump uses:

textcasesTwitterHandle = TextCases[StringJoin[tweettexts], "TwitterHandle"];

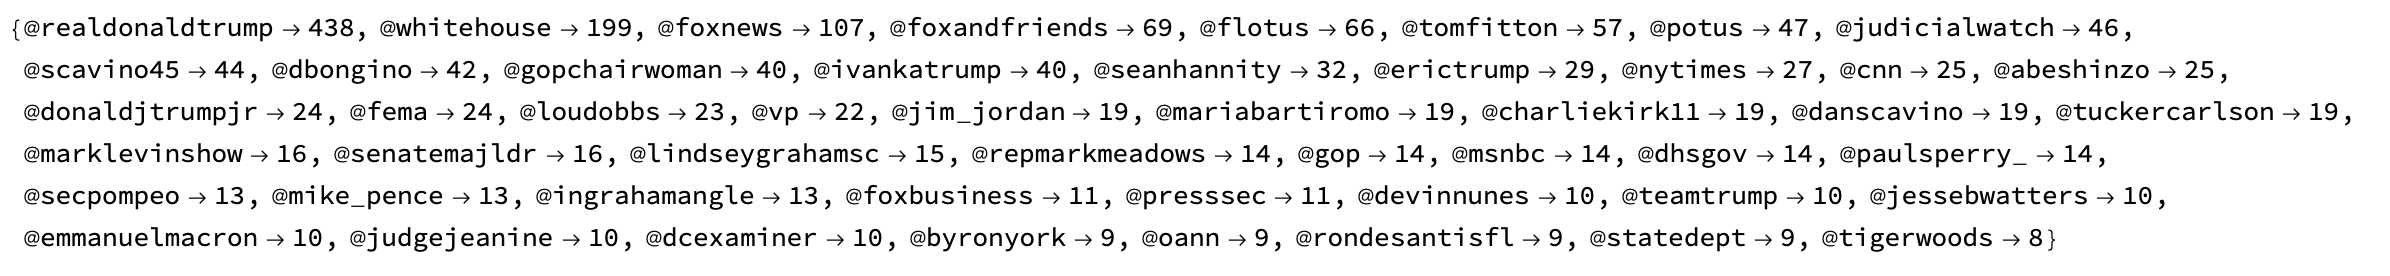
Here are counts of the 50 most common handles:

twitterhandles50 = Normal[(ReverseSort@Counts[ToLowerCase /@ textcasesTwitterHandle])[[1 ;; 50]]]

enter image description here

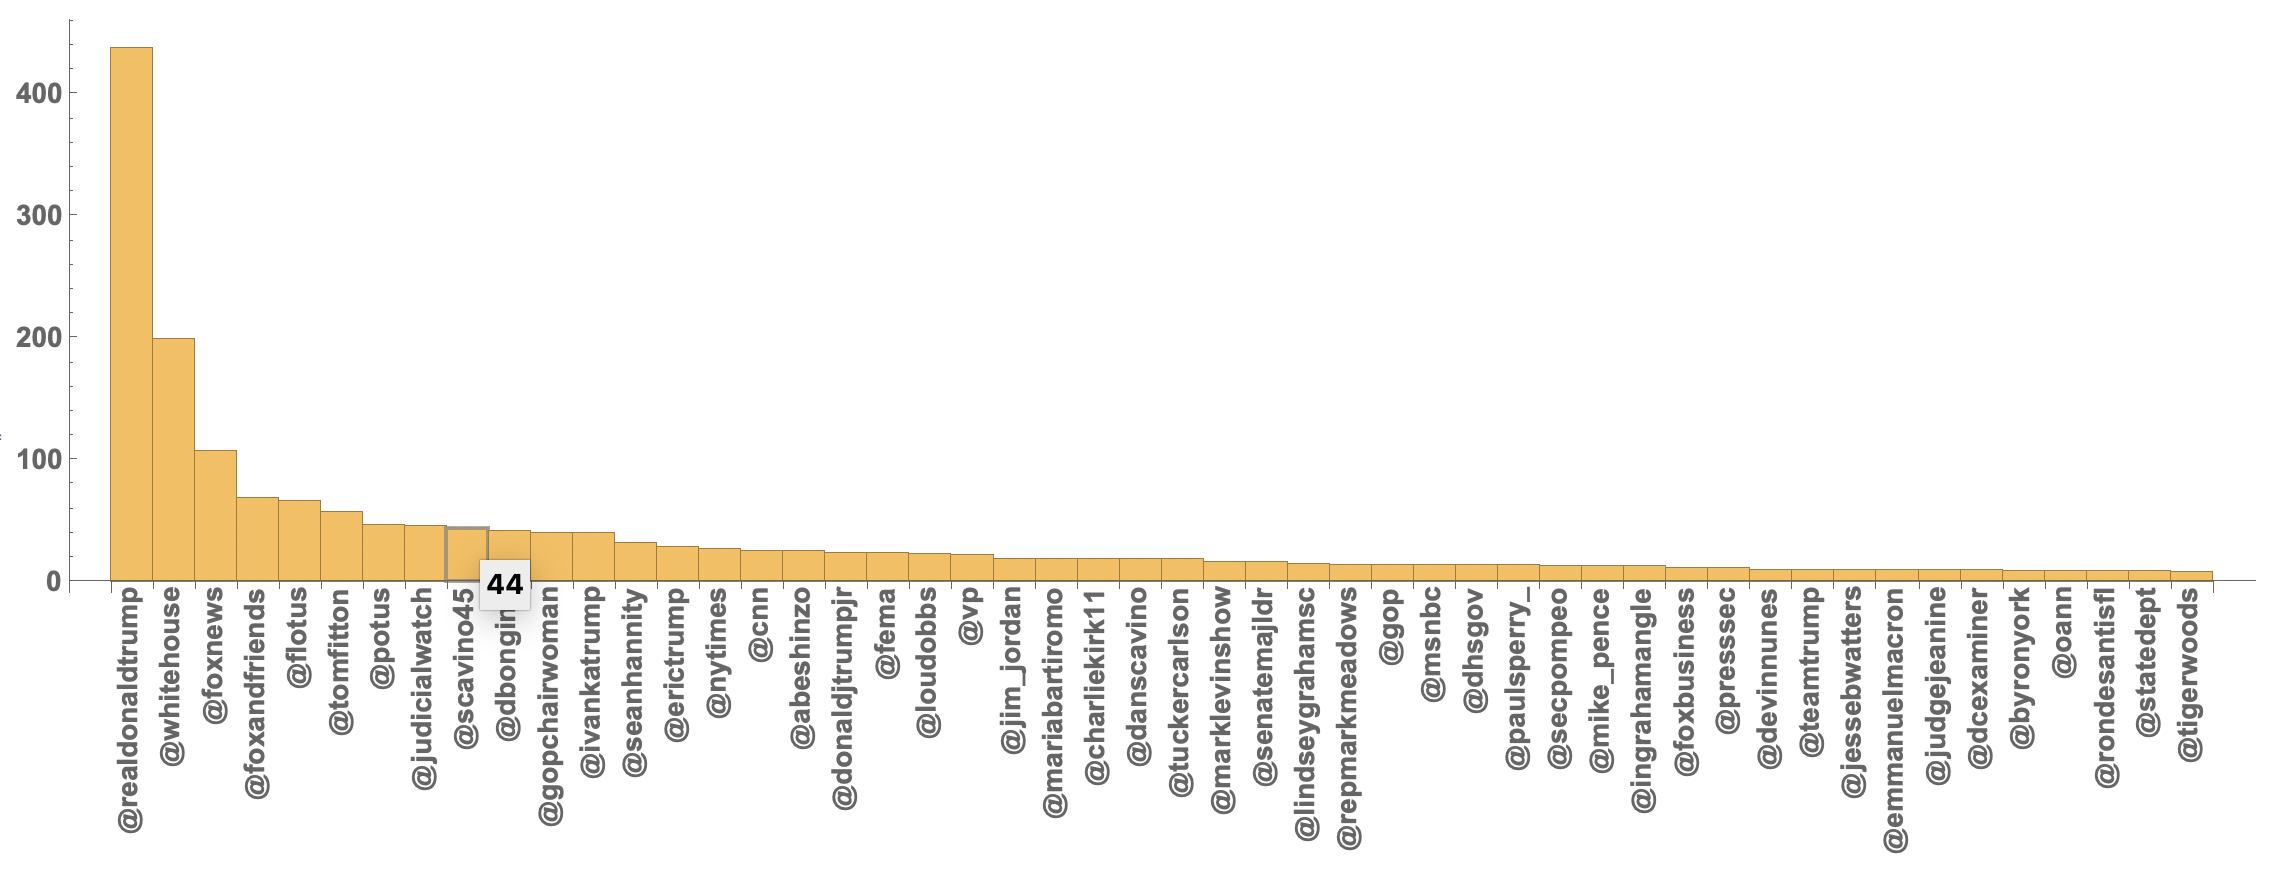
Last but not least we can make a BarChart of that:

BarChart[<|twitterhandles50|>, ChartLabels -> (Rotate[#, Pi/2] & /@ twitterhandles50[[All, 1]]), 
LabelStyle -> Directive[Bold, 14]]

enter image description here

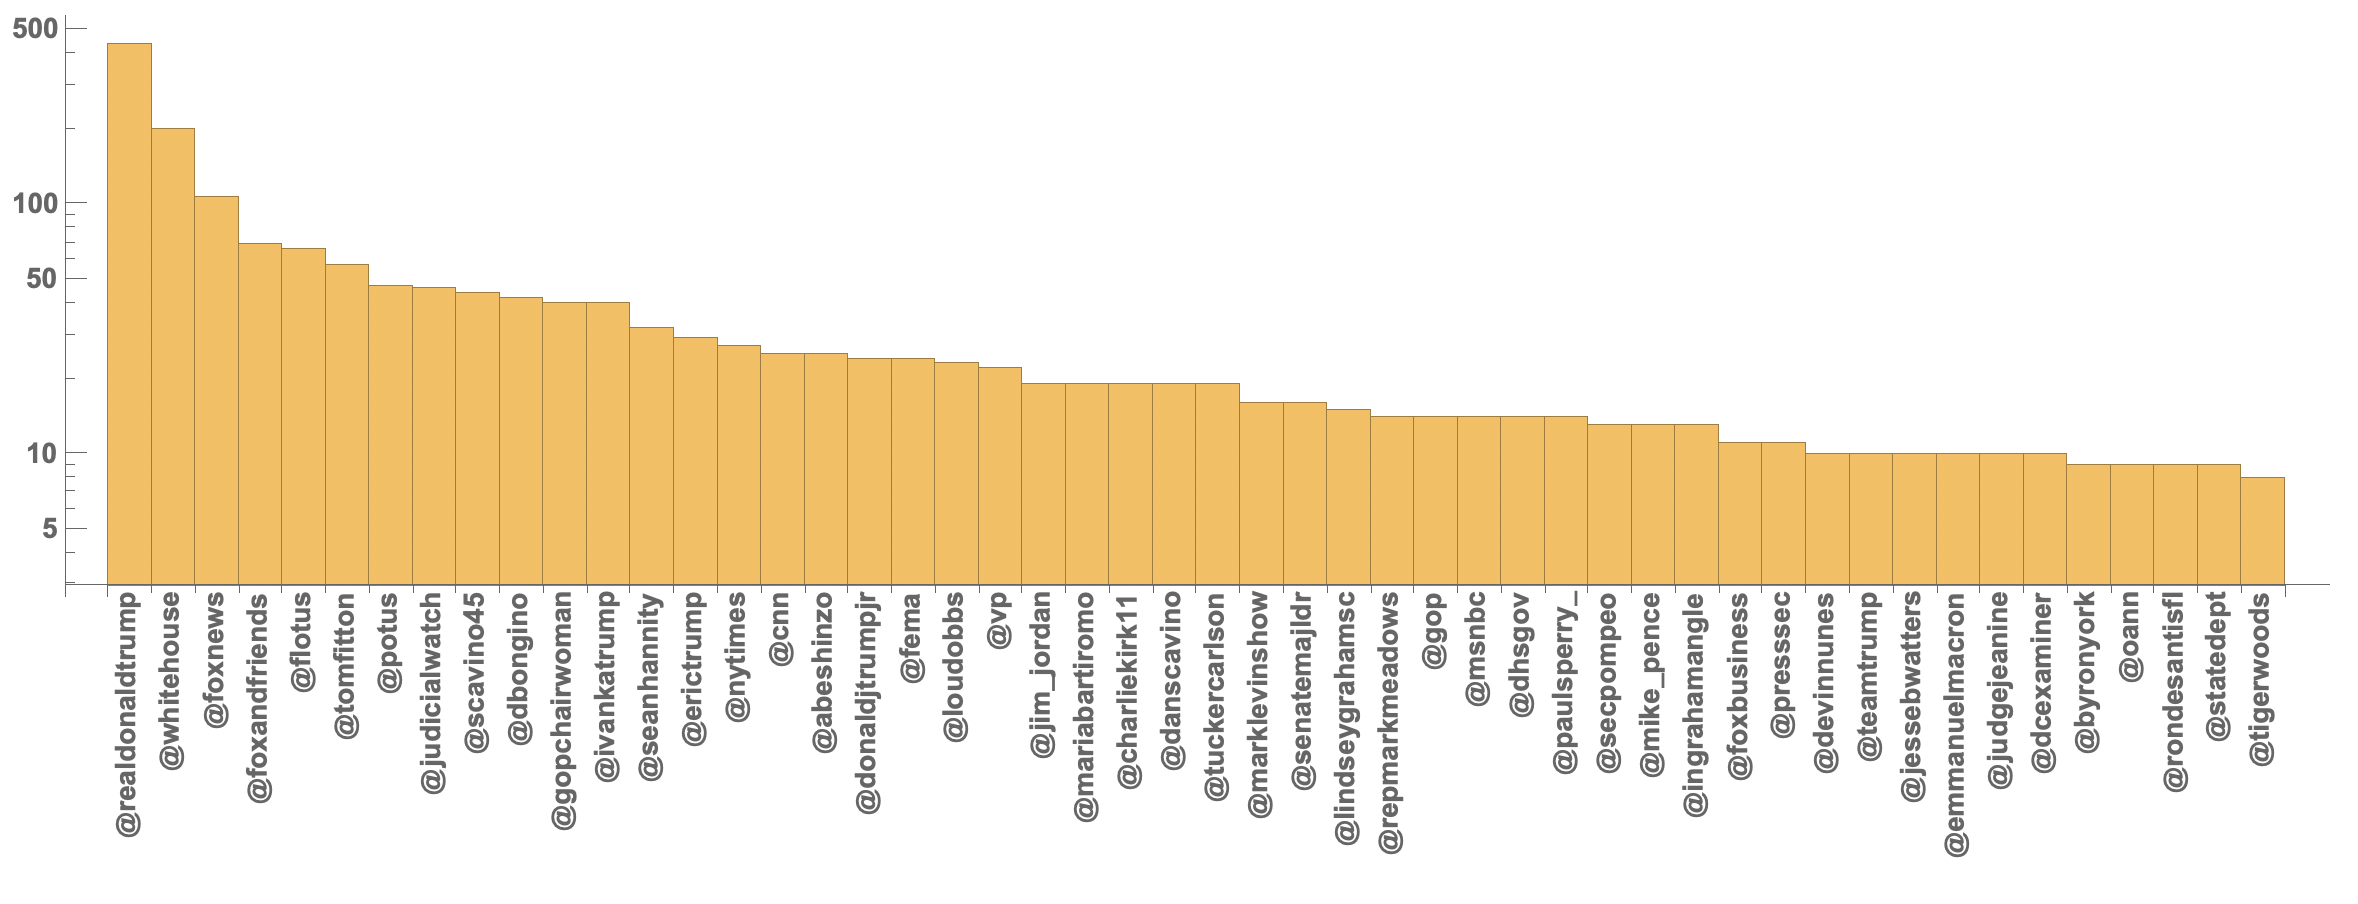
and to compare the same on a logarithmic scale:

BarChart[<|twitterhandles50|>, ChartLabels -> (Rotate[#, Pi/2] & /@ twitterhandles50[[All, 1]]), 
LabelStyle -> Directive[Bold, 14], ScalingFunctions -> "Log"]

enter image description here

A little word cloud

Just to finish off we will generate a little word cloud like so:

allwords = Flatten[TextWords /@ tweettexts];
WordCloud[ToLowerCase /@ DeleteCases[DeleteStopwords[ToString /@ allwords], "&amp;"]]

enter image description here

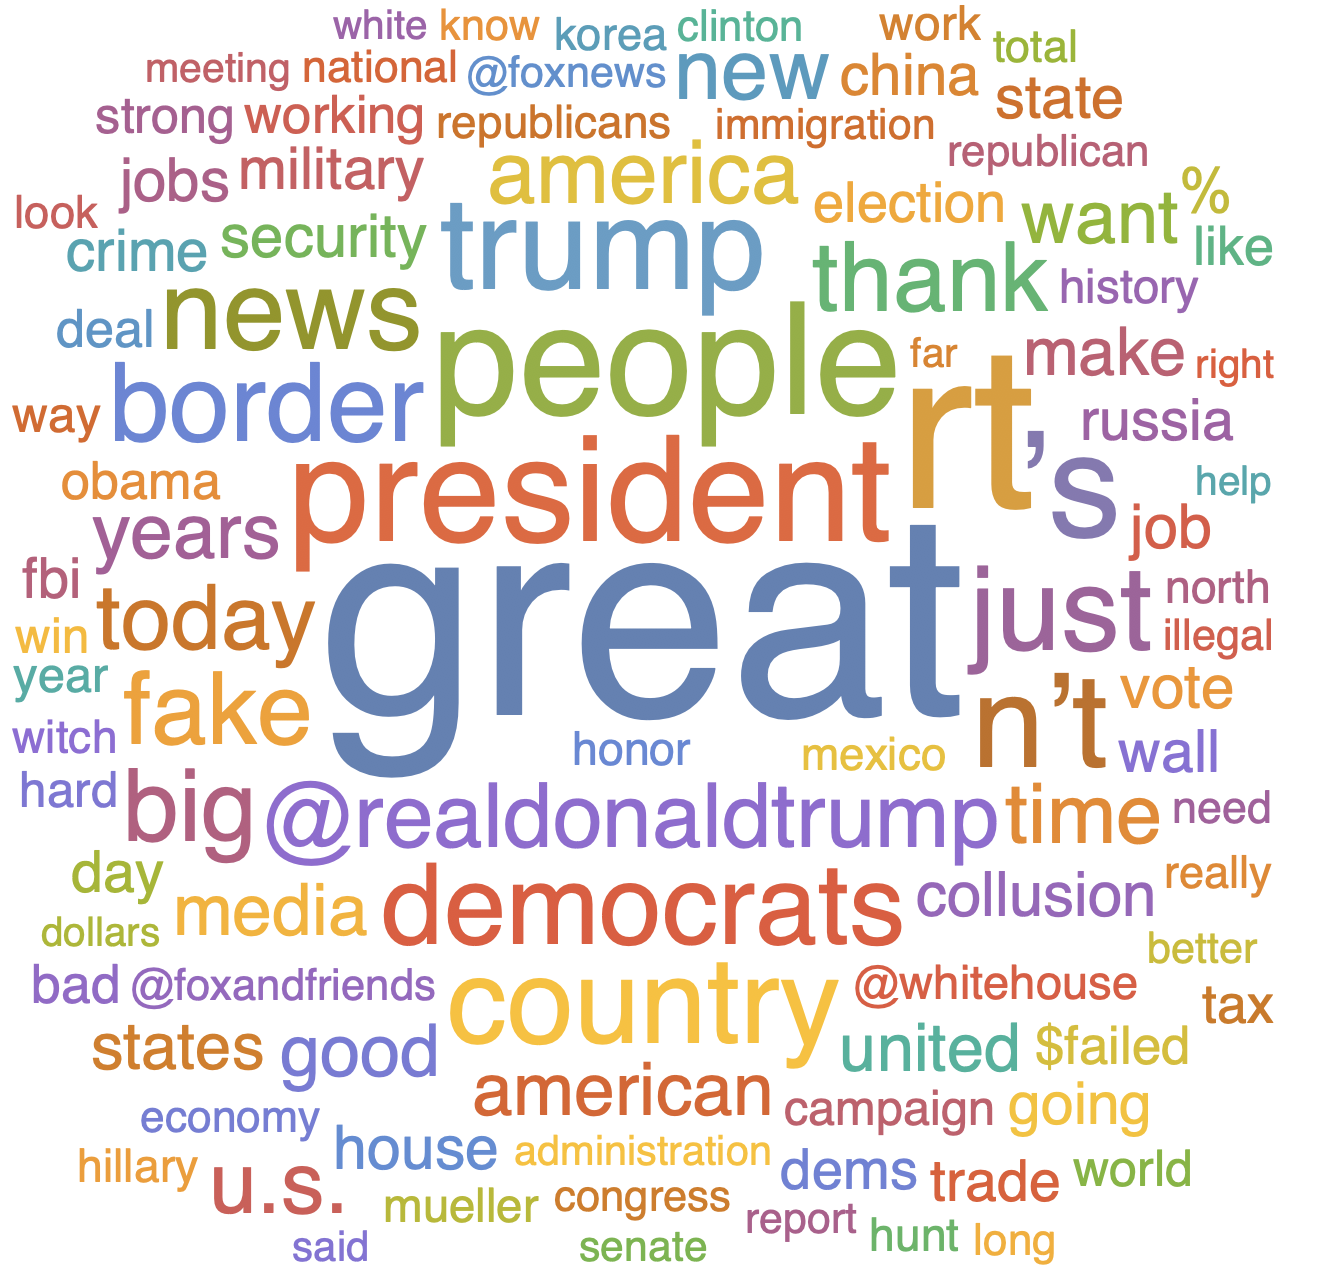
The cloud picks up on "witch hunt" and "collusion", "@foxandfrieds" and "Russia", "fake", "border" as well as other terms that indeed are relatively prominent in the media.

Conclusion

The main objective of this was to look try to reproduce at least qualitatively the results of the twitter analysis of @realDonaldTrump's tweets by The Economist using the Wolfram Language. We have been using a slightly different period of the tweets. We have been looking at direct mentions and "indirect" ones. I have not made any manual comparison of the results. I am not sure whether the recognition has worked and I only post it as a first cursory analysis.

It was relatively easy to go beyond the analysis and look at other features of the tweets, too.

POSTED BY: Marco Thiel
19 Replies
Posted 4 years ago

Thanks for a fascinating post! I am a rank Wolfram Alpha newbie and would never thought to apply Wolfram in this way. Plenty of things in your post to learn and to try.

POSTED BY: Ralph Wild
Posted 5 years ago

Dear Marco,

Following your advice, I have been able to create the associated applet.

Thanks

Alan

POSTED BY: Alan Mok

Dear Alan,

well, you can create your own applet. The first thing is that you will need to decide where you want to save your data. For the OP I have used Google Drive, but I usually use Wolfram's data drop. Let's assume that you have linked your twitter account and Datadrop to IFTTT. You will also need to create a Databin and write down its id. For this illustration I will use my newly created private databank (FfI75hEn).

When you login to IFTTT you will have to make a new applet.

enter image description here

As usual you click on the this link. Then you choose Twitter and look at the triggers.

enter image description here

Then you have to choose "New tweet by specific user". After typing in the user name you confirm and will get to the "then" stage. There you choose datadrop and that you want to add something to a databin:

enter image description here

Then you fill in the details, i.e. the id of the databin and what you want to record:

enter image description here

You click create action and then on the next window

enter image description here

you click Finish.

With a bit of luck that should do the trick. If you have this in Datadrop it will be easier to import and analyse the data.

I hope this helps,

Marco

POSTED BY: Marco Thiel
Posted 5 years ago

Marco,

I enjoy reading your post and have successfully completing the analysis. However, at first I encountered NetGraph problem and solved it based on the method you recommended.

I have a follow up question on the IFTTT. If I want to automatically save selected twits, which addon in IFTTT should I use ?

Thanks

Alan

POSTED BY: Alan Mok
Posted 5 years ago

Kotaro-san,

Thank you for the suggestion, but I get the same result. Actually they are equivalent.

Flatten@Table[dataraw[[i, 1, All, 2]], {i, 1, Length@dataraw}] == 
 Flatten@dataraw[[All, All, All, 2]]
(* True *)

I tried restarting the kernel, but I still get the same error.

NetGraph::netinvseq: Invalid sequence {Which[<<1>>],<<43>>} provided to net.

I am running "12.0.0 for Mac OS X x86 (64-bit) (April 7, 2019)"

Any other suggestions?

Thanks, Rohit

POSTED BY: Rohit Namjoshi

Rohit-san, I'm sorry i have no idea. I am running "12.0.0.0 for Windows10 (64-bit)" My result is the below. enter image description here

POSTED BY: Kotaro Okazaki

Dear Rohit and Kotaro-san,

it also does run on my computer without any problem. I am not sure what goes wrong, but I seem to remember that I had something similar several times. What did appear to help is resetting Mathematica as described here.

Note that this comes with potential problems (e.g. if you have modified the init file).

Best wishes,

Marco

POSTED BY: Marco Thiel
Posted 5 years ago

Hi Marco,

Thanks for the suggestion. Rather than a complete reset, I just deleted the contents of $CacheBaseDirectory and that resolved the issue. Looks like the cache was corrupted.

I noticed a couple of discrepancies with your results.

In the count of indirect reference countries I see a significantly higher number for United States. Since you mentioned that you ignored errors, it is possible that GeoIdentify succeeded more often for me.

enter image description here

The count of Twitter handles. I have no explanation for this discrepancy.

{"@realdonaldtrump" -> 493, "@whitehouse" -> 235, 
 "@foxandfriends" -> 141, "@foxnews" -> 140, "@flotus" -> 90, 
 "@potus" -> 67, "@scavino45" -> 60, "@tomfitton" -> 57, 
 "@ivankatrump" -> 54, "@nytimes" -> 50, "@seanhannity" -> 47, 
 "@judicialwatch" -> 46, "@dbongino" -> 42, "@gopchairwoman" -> 42, 
 "@vp" -> 41, "@erictrump" -> 36, "@cnn" -> 33, "@fema" -> 32, 
 "@loudobbs" -> 31, "@donaldjtrumpjr" -> 27, "@abeshinzo" -> 25, 
 "@tuckercarlson" -> 23, "@jim_jordan" -> 22, "@danscavino" -> 21, 
 "@senatemajldr" -> 21, "@mariabartiromo" -> 20, 
 "@charliekirk11" -> 20, "@gop" -> 19, "@foxbusiness" -> 18, 
 "@emmanuelmacron" -> 17, "@dhsgov" -> 17, "@repmarkmeadows" -> 16, 
 "@marklevinshow" -> 16, "@lindseygrahamsc" -> 16, "@msnbc" -> 15, 
 "@mike_pence" -> 15, "@judgejeanine" -> 14, "@paulsperry_" -> 14, 
 "@ingrahamangle" -> 14, "@secpompeo" -> 13, "@netanyahu" -> 13, 
 "@washingtonpost" -> 12, "@presssec" -> 12, "@stevescalise" -> 11, 
 "@nbcnews" -> 11, "@drudge_report" -> 11, "@jessebwatters" -> 11, 
 "@dcexaminer" -> 11, "@abc" -> 11, "@devinnunes" -> 10}

Neither of the discrepancies impact your conclusions.

I agree with Vitaliy. Your post is a great example of "Computational Journalism", we need more of that.

Rohit

POSTED BY: Rohit Namjoshi

Dear Rohit,

Thank you very much for your message and the time it took you to run everything. It is possible that GeoIdentify worked better for you. But I have another hypothesis. As far as I can see you are based in the US. I ran the code from Scotland. The interpreter is a complicated thing. I think that if I type in "Aberdeen" it will take the one in Scotland (where I am based), if you use the Interpreter in the US that might give different results especially if you are in one of the "other" Aberdeens. This is based on the GeoIP; and I am right now not even sure whether I had a VPN server running at that time.

I think that we might get more homogeneous results if we set the $GeoLocation to the same place. We will still not necessarily get exactly the same because we use different Wolfram Server and there might be differences with requests timing out.

If anyone has a private cloud that would be interesting. Also, I could try to identify the cases that were not recognised properly and run the recognition again, or help manually.

All of this, of course, raises the question of error bars. It would be great to get a feeling for errors by reviewing say 100 detections by hand, ideally by 3 different people and figure out how often the algorithm is right (and also how often the people agree or disagree.

It is interesting how easy it is get get some results, but how difficult it is to get the exact same results.

At first, I was more concerned about the twitter handles. But that I could resolve. I think I posted a wrong table. When I rand the code the first time, I did not use the file "Trump Tweets.xlsx" only the ones with the numbers in the brackets, I believe.

I now ran it again and get your results:

enter image description here

Sorry for that. You can reproduce my error if you load only the first for files at the beginning, i.e.:

tweettextswrong = Join[dataraw[[1, 1]], dataraw[[2, 1]], dataraw[[3, 1]], dataraw[[4, 1]]][[All, 2]]

textcasesTwitterHandlewrong = TextCases[StringJoin[tweettextswrong], "TwitterHandle"];

twitterhandles50wrong = Normal[(ReverseSort@Counts[ToLowerCase /@ textcasesTwitterHandlewrong])[[1 ;; 50]]]

That should give you the numbers from my original post.

Again, thanks for pointing this out.

Best wishes,

Marco

POSTED BY: Marco Thiel
Posted 5 years ago

Hi Marco,

Thank you for this nice analysis. I am trying to reproduce your results and ran into an issue. In the following expression, tweettexts is not defined

locations =  TextCases[StringJoin[tweettexts], "LocationEntity" -> "Interpretation", VerifyInterpretation -> True];

I tried

tweettexts = dataraw[[All, All, All, 2]];

but that causes TextCases to fail with

NetGraph::netinvseq: Invalid sequence {Which[<<1>>],<<43>>} provided to net.

Could you please provide the definition of tweettexts or attach a notebook with all of the code.

Thanks, Rohit

POSTED BY: Rohit Namjoshi

Rohit-san, I hope this might help you.

tweettexts = 
 Flatten@Table[dataraw[[i, 1, All, 2]], {i, 1, Length@dataraw}]
POSTED BY: Kotaro Okazaki

Sorry I have updated the post. There was a line of code missing. It is not the best version Kotaro-san's solution is much better, but I used it at the beginning to exclude certain parts of the tweets.

Thank you very much for taking the time and spotting this. You are making my point: if there are mistakes or problems in the code they can be discovered and pointed out. it would be kind of cool if we could do that with stats and arguments that commonly come up in articles and discussions.

Thanks a lot,

Marco

POSTED BY: Marco Thiel

enter image description here - Congratulations! This post is now featured in our Staff Pick column as distinguished by a badge on your profile of a Featured Contributor! Thank you, keep it coming, and consider contributing your work to the The Notebook Archive!

POSTED BY: Moderation Team

Dear @Marco, this some cool computational journalism! I was so looking forward to seeing your posts, thank you! And I cannot wait to meet up at the Wolfram Tech Conference. There is, BTW, a new a bit more powerful way to check sentiment (and it has more tricks up the sleeve):

Sentiment Language Model Trained on Amazon Product Review Data

https://resources.wolframcloud.com/NeuralNetRepository/resources/Sentiment-Language-Model-Trained-on-Amazon-Product-Review-Dataset

POSTED BY: Vitaliy Kaurov

Dear Vitaliy,

I am really excited to be at the WTC. It is just fantastic to speak with so many innovative people making every possible area computational.

I can try the alternative way to do sentiment analysis. I've run it on some other dataset. There are many more analyses that we could do with the Wolfram Language here. In the new degree on Data Science that we will offer at the University we will have quite some example on Natural Language Processing. I hope that this will grow into a full course in the near future.

Me too, I am very much looking forward to speaking with you at the WTC. I hope we will have the opportunity to speak before that.

Best wishes,

Marco

POSTED BY: Marco Thiel

Marco-san, thank you for a nice post. Your posts are always very helpful to me. I'm looking forward to watching your presentation at the Wolfram Technology Conference. I'll watch it on the web in Japan.

POSTED BY: Kotaro Okazaki

Kotaro-san

thank you very much for your kind words. I am very much looking forward to the WTC. It is a fantastic event and I always learn a lot there. I

It is a pity that you cannot be there this year; I very much enjoy your posts and would very much enjoy the opportunity to talk with you.

Best wishes,

Marco

POSTED BY: Marco Thiel

It's awesome that you attempt to verify The Economist's claim of "1,384 mentions", and show that the claim was incorrect. This is an interesting post. Thank you.

POSTED BY: Nam Tran

Dear Nam Tran-Hoang,

Thank you very much for your kind reply. You actually raise an interesting point when you say that I showed that their claim is incorrect. I actually do not even now how I would formally do that.

The point is that I don't know what exactly they did. I might have overlooked a link to their algorithm, but I could not find it. So what did they do? Did they include retweets? Did they only count direct mentions or also indirect ones (i.e. airport Heathrow -> mention of UK)? Did they do this by hand? Did they run a machine learning algorithm? I simply do not know. That makes it difficult to verify what they say for me.

I think that the Wolfram Language is a great tool to make these questions "computational", i.e. reproducible and potentially opens them up to criticism. In that I do there are lots of open questions; someone pointed out to me that Georgia might be a state or a country. If we use indirect mentions we need to decide whether Aberdeen is the one in the UK or one of the US ones, etc.

I am concerned about the state of our discussion culture. As many statements can just be put out there - often they are too hazy to address. I think that a computational language can contribute to a better discussion culture.

My analysis is far from perfect and has lots of bits that can and should be improved. But at least it is open to criticism - and I welcome that.

Thanks a lot for your time to read my post and your reply,

Marco

POSTED BY: Marco Thiel
Reply to this discussion
Community posts can be styled and formatted using the Markdown syntax.
Reply Preview
Attachments
Remove
or Discard

Group Abstract Group Abstract