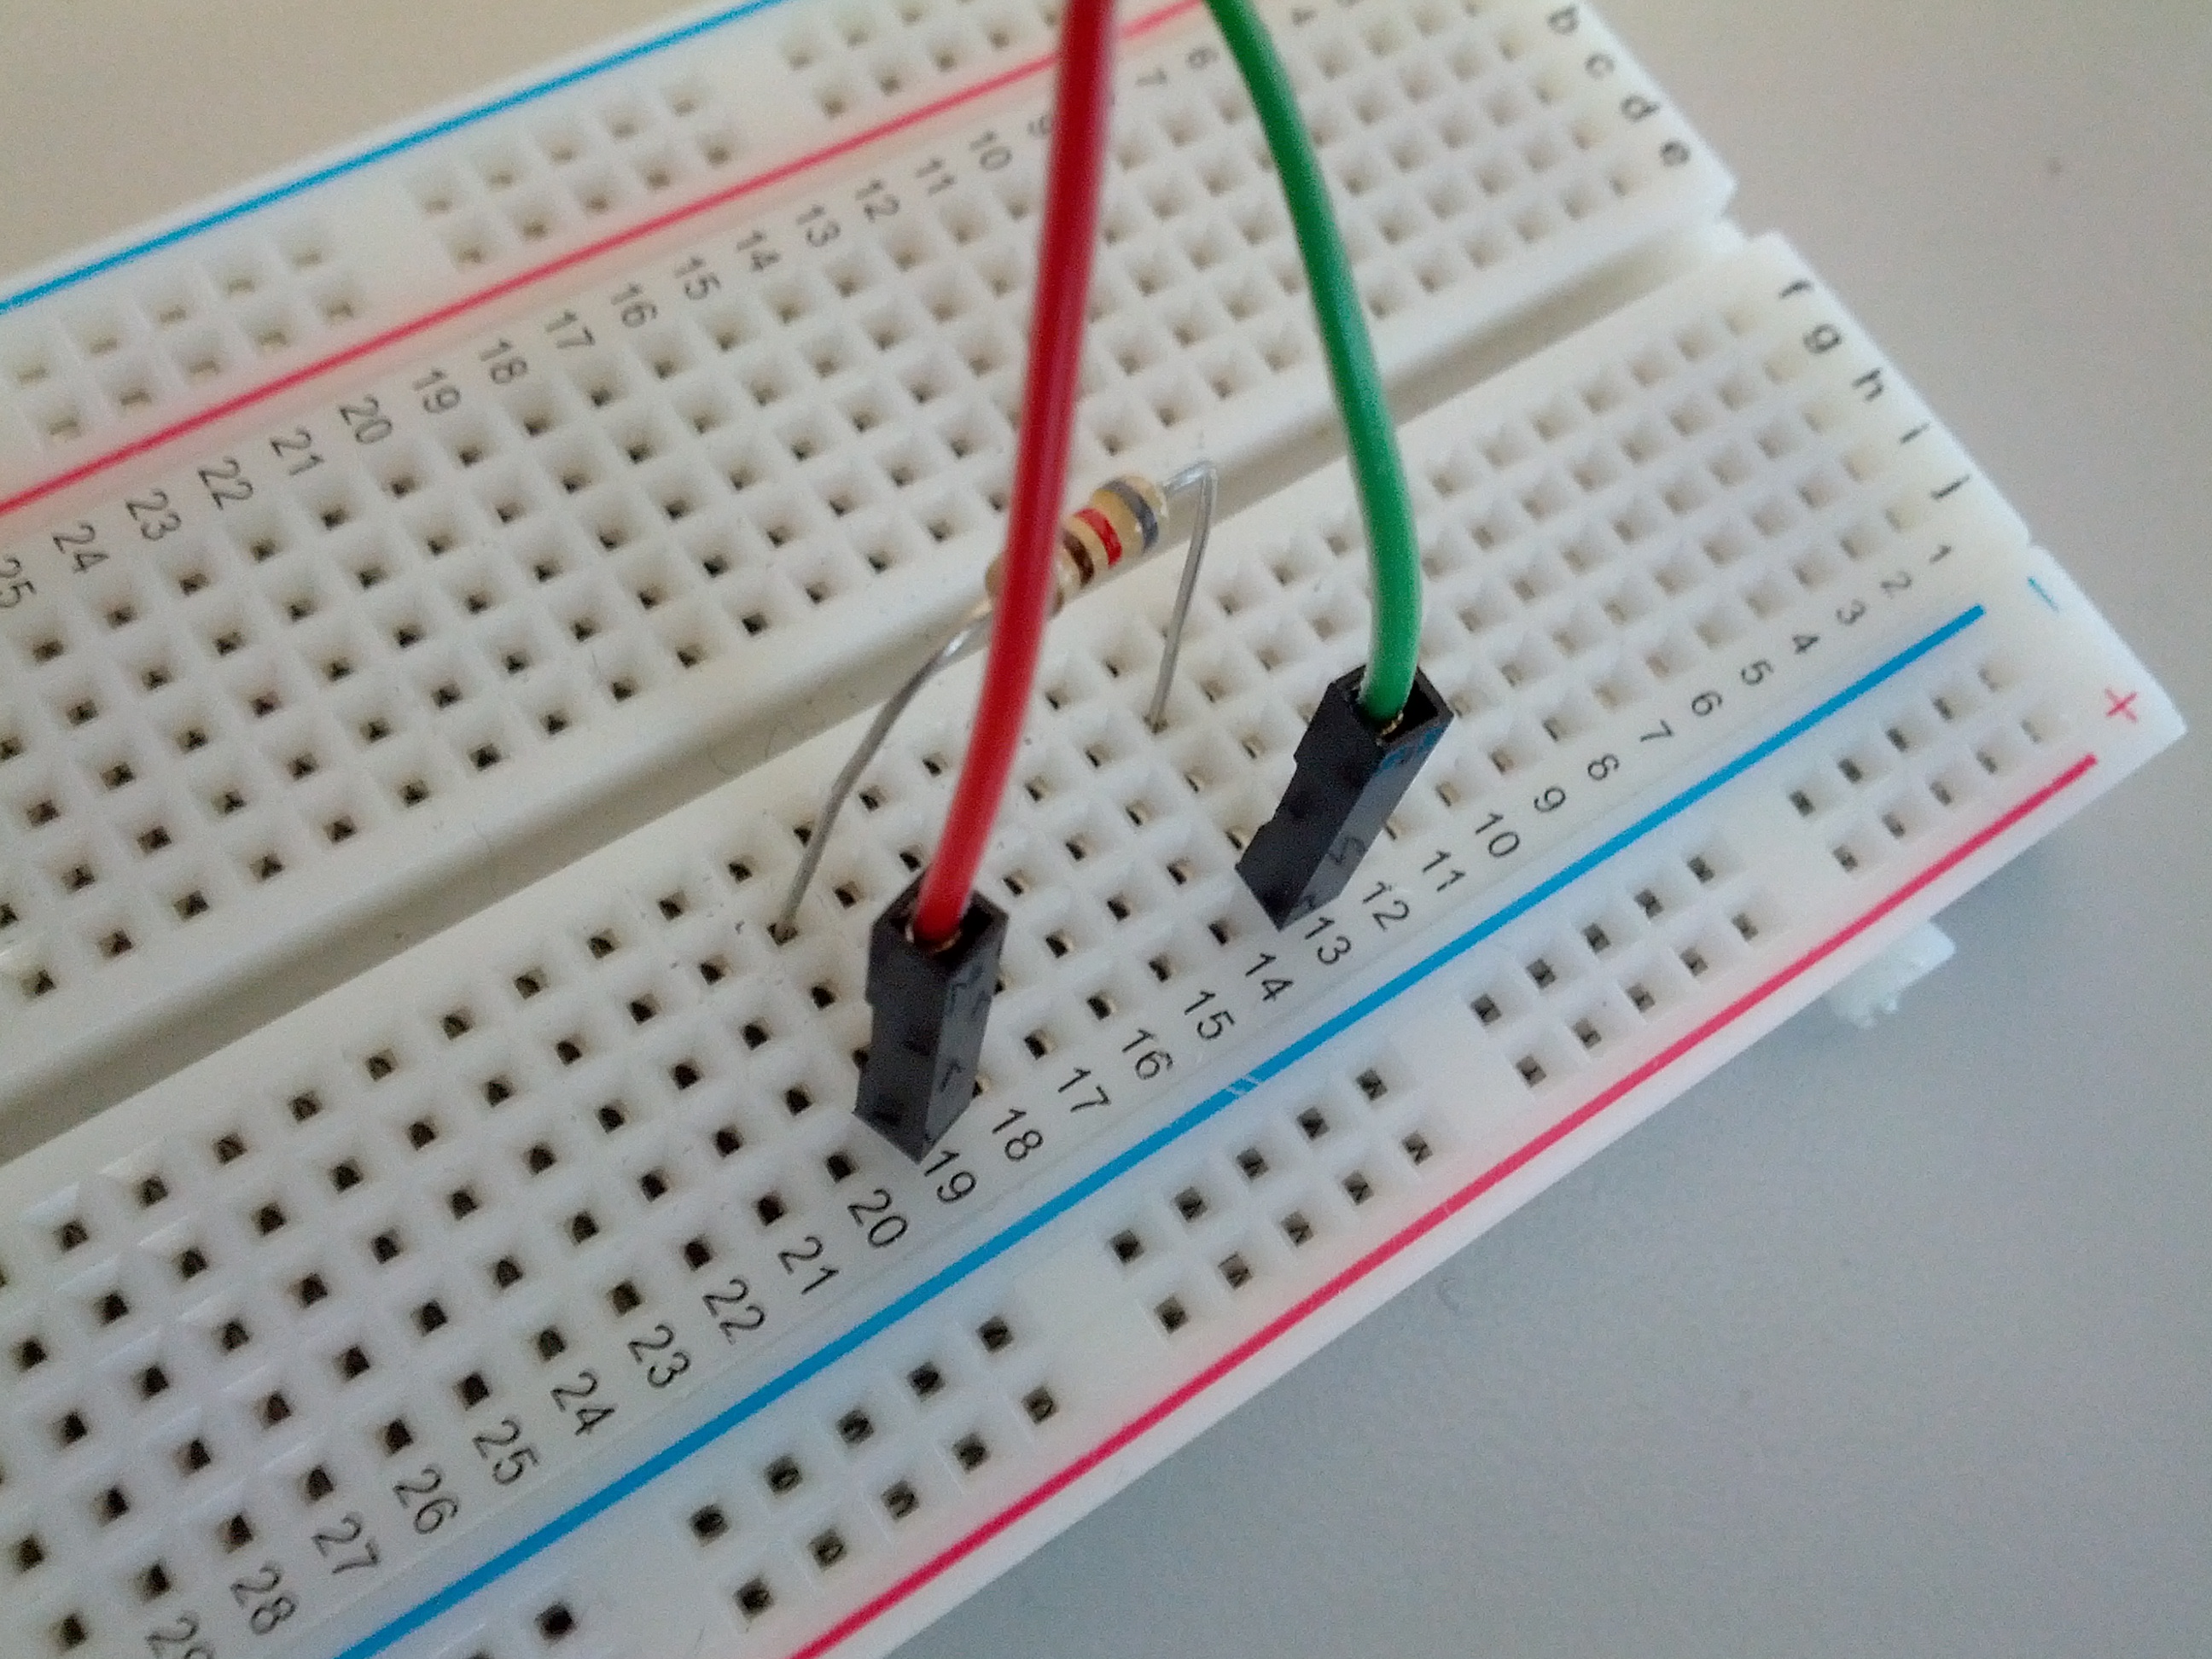
For this experiment you will need a bread board, a resistor (I used 820 ohm) and two jumper wires.
First start the wolfram language and configure the GPIO device. In this we will use GPIO pin 17 and use it for input:
DeviceConfigure["GPIO", 17 -> "Input"]
Next, connect one wire (red in the picture) to the 3.3V output and the other (green in the picture) to GPIO pin 17.
Connect the wires and the resistor on the bread board as shown:

We can check if pin 17 is reading this configuration as "high":
DeviceRead["GPIO", 17]
This should return {17->1}. If you disconnect either the red or green cable the DeviceRead command will return {17->0}.
Now let's run the same command, but record all data for 10 seconds in 0.1 second intervals and return this data as a time series:
ts = DeviceReadTimeSeries["GPIO", {10, .1}, 17]
While this command is running plug and unplug a cable a few times to get both "high" and "low" sensor readings.
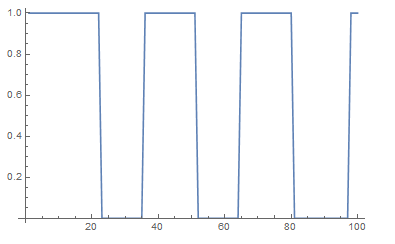
At the end you can examine the data by plotting the data points:
ts["ValueList"][[1, All, 1, 2]] // ListLinePlot
