This post will demonstrate how to use the function DeviceReadTimeSeries with your Raspberry Pi and the GPIO pins. This post is an update of this one.
You will need the following for this:
- Raspberry Pi
- 10k Ohm Resistor
- Momentary Push-button (this can be foregone if one just quickly unhooks one of the wires and hooks it back up quickly)
First we start up the Mathematica from the command line with the following (if you're already in the GUI, you can also just click on the Mathematica icon)
pi@raspberry-wri2 ~ $ mathematica
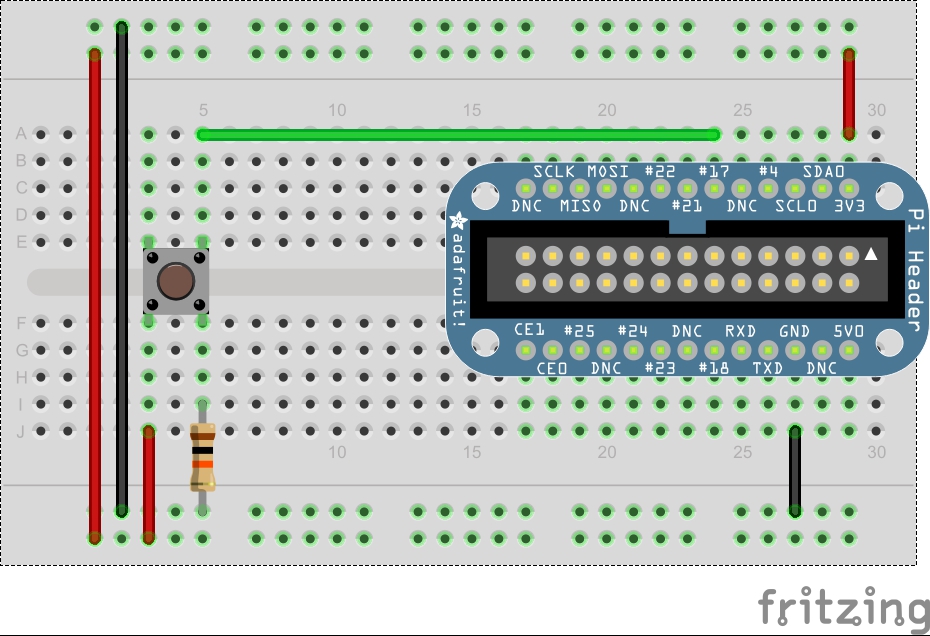
Now, we can hook up the button and resistor as shown below in the Fritzing Diagram. GPIO pin 17 is tied to ground normally through a pulldown resistor, and when the button is pressed, it is momentarily brought up to a high voltage through (3.3 volts).

Now from Mathematica, we can run the following command, which configure pin 17 as an input.
DeviceConfigure["GPIO", 17->"Input"]
To read the pin over a period of time, we now run:
data=DeviceReadTimeSeries["GPIO",{timeTotal,timeInterval},17]
where the timeTotal represents the total amount of time Mathematica should collect data, and timeInterval represents how long it should wait before taking another reading. For now, let's use 5 as total time and .2 as our interval, giving us 25 data points. During this time press the button a few times, or else there will be no change and our data will be quite boring.
To take the values from this, we use
Flatten[data["Values"]]
Which returns a list of each value. To visually plot this we can use the following:
ListLinePlot[Flatten[data["Values]]]
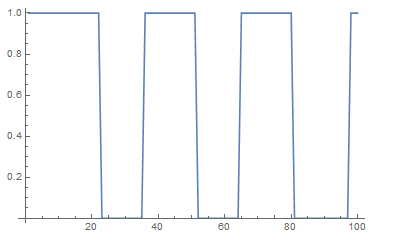
Which should produce some sort of graph like the following where the line spikes back and forth between 0 (button not pressed) and 1 (button pressed). Note the picture below is for 100 values, yours may look different.
