Message Boards Message Boards

Simulating brain tumor growth with diffusion-growth model

enter image description here

When playing with Mathematica 10 I constructed this very simple example of an application of the NDSolve command, which I wanted to share. The objective is to model the growth of a special kind of brain tumour which affects mainly glial cells in a highly simplified way. I follow modelling ideas discussed in the excellent book "Mathematical Biology" (Vol 2) by J.D. Murray. It turns out that Gliomas, which are neoplasms of glial cells, i.e. neural calls capable of division, can be be modelled by a rather simple diffusion-growth model.

$$\frac{d c}{dt}=\nabla\left(D(x) \nabla c \right)+ \rho c$$

where c is the concentration of cancer cells and $D(x)$ is the diffusion coefficient, which depends on the coordinates; $\rho$ models the growth rate of the cells. The following boundary condition has to be observe (even though will be ignored in the model I use later on):

$${\bf n} \cdot D(x) \nabla c = 0 \qquad \text{for}\; x\; \text{on}\; \partial B.$$

In reality the diffusion coefficient will depend on the tissue type, i.e. gray matter vs white matter. I will use an image from a CT can to describe the different densities of the tissue instead.

enter image description here

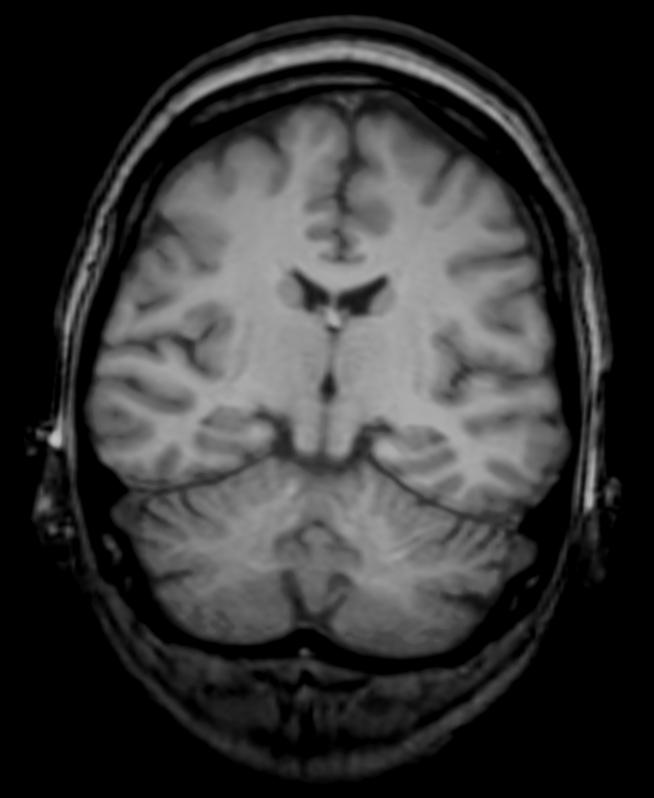
In the book by Murray great care is taken to estimate the diffusion coefficient but I just want to show the principle here. I use the attached file "brain-crop.jpg" and import it:

img2=Import["~/Desktop/brain-crop.jpg"]

Then I sharpen it and convert it to gray-scale.

img3 = Sharpen[ColorConvert[img2, "Grayscale"]]

Then I use that image to determine the diffusion coefficient, locally:

diffcoeff = ListInterpolation[ImageData[img3], InterpolationOrder -> 3]

I should now determine the boundaries using something like EdgeDetect. As the background is black and allows no diffusion at all, we can simplify this by just setting a larger (rectangular) boundary box like so:

boundaries = {-y, y - 1, -x, x - 1};

\[CapitalOmega] = 
  ImplicitRegion[And @@ (# <= 0 & /@ boundaries), {x, y}];

Next we can solve the ODE on the domain:

sols = NDSolveValue[{{Div[1./500.*(diffcoeff[798.*x, 654*y])^4*Grad[u[t, x, y], {x, y}], {x, y}] - D[u[t, x, y], t] + 0.025*u[t, x, y] == NeumannValue[0., x >= 1. || x <= 0. || y <= 0. || y >= 1.]}, {u[0, x, y] == Exp[-1000. ((x - 0.6)^2 + (y - 0.6)^2)]}}, u, {x, y} \[Element] \[CapitalOmega], {t, 0, 20}, Method -> {"FiniteElement", "MeshOptions" -> {"BoundaryMeshGenerator" -> "Continuation", MaxCellMeasure -> 0.002}}]

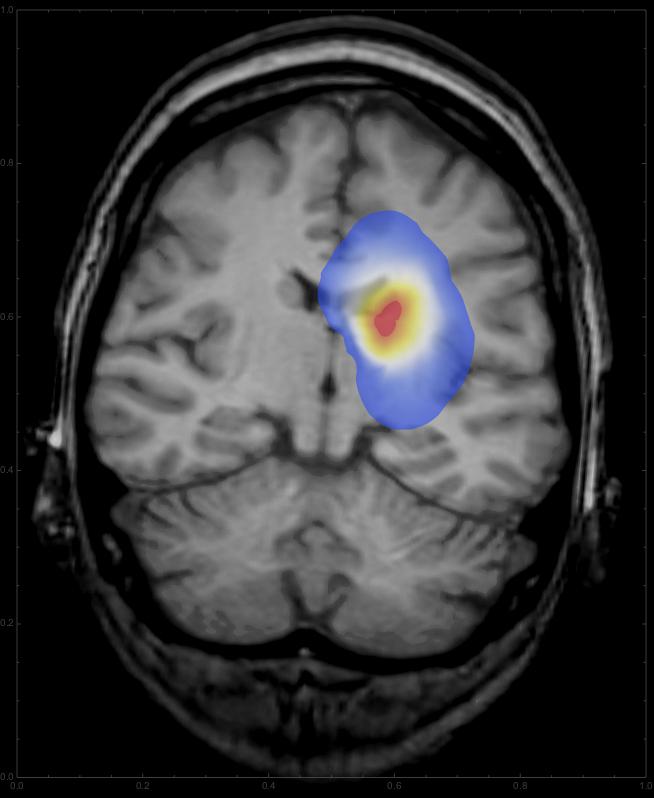
Note that we start with an initially Gaussian distributed tumour and describe its growth from there. Also I took the fourth power of the diffcoeff function, which changes the relation between grayscale and diffusion rate. You can change the coefficient to get different patterns for the growth. Interestingly, this integration gives a warning about intersecting boundaries in MMA10, which it did not say in the Prerelease version; if someone can fix that, that would be great. For any time we can now overlay the resulting distribution onto the CT image:

ImageCompose[img3, {ContourPlot[
   Max[sols[t, x, y], 0] /. t -> 2, {y, 0, 1}, {x, 0, 1}, 
   PlotRange -> {{0, 1}, {0, 1}, {0.01, All}}, PlotPoints -> 100, 
   Contours -> 200, ContourLines -> False, AspectRatio -> 798./654., 
   ColorFunction -> "Temperature"], 0.6}]

This should give something like this:

enter image description here

Using

frames = Table[
   ImageCompose[
    img3, {ContourPlot[
      Max[sols[d, x, y], 0] /. d -> t, {y, 0, 1}, {x, 0, 1}, 
      PlotRange -> {{0, 1}, {0, 1}, {0.01, All}}, PlotPoints -> 100, 
      Contours -> 200, ContourLines -> False, 
      AspectRatio -> 798./654., ColorFunction -> "Temperature"], 
     0.6}], {t, 0, 10, 0.5}];

we get a list of images,

enter image description here

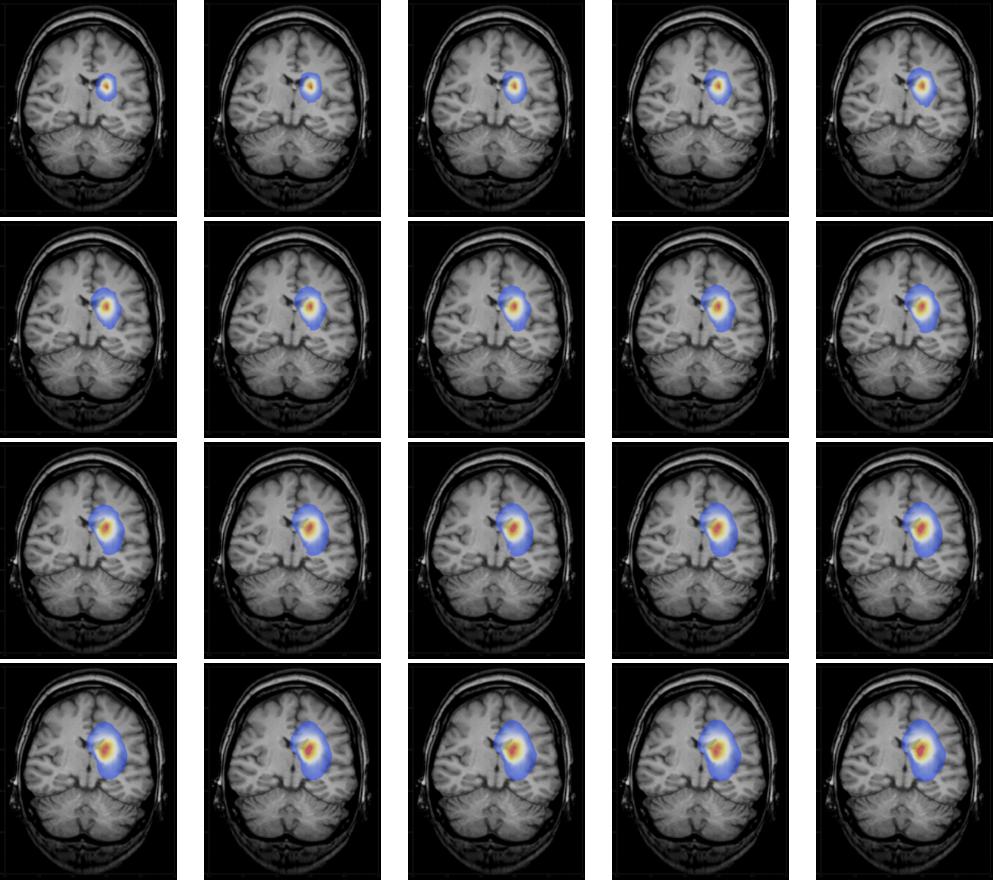
which can be animated

ListAnimate[frames, DefaultDuration -> 20]

to give

enter image description here

This is only a very elementary demonstration, and certainly still far away from a "real" medical application, but it demonstrates the power of NDSolve and might, in a modified form, be useful as a case study for some introductory courses.

Cheers, Marco

POSTED BY: Marco Thiel
10 Replies

enter image description here -- you have earned Featured Contributor Badge enter image description here Your exceptional post has been selected for our editorial column Staff Picks http://wolfr.am/StaffPicks and Your Profile is now distinguished by a Featured Contributor Badge and is displayed on the Featured Contributor Board. Thank you!

POSTED BY: Moderation Team

Hi Marco, thank you for this excellent presentation. It has really helped me. I just need further explanation on the roles of the first two equations (of diffusion growth model) in this analysis and the final animation. I like to modify this equation slightly using the same image and hence, I need to be sure I am running the code in the correct context. Thank you.

POSTED BY: Dean Ezekiel

Dear Henrik,

thank you very much for you message. I have just tried to follow what Murray does in the book I referenced and he speaks of CT images. He cites a PhD thesis (Swanson, Mathematical Modeling of the Growth and Control of Tumors, PhD thesis - University of Washington, 1999) and a paper (Swanson et al., A quantitative model for differential motility of gliomas in grey and white matter, Cell Prolif., 33:317, 2000) and states that they used CT scans. He appears to be senior author on the Swanson paper as well.

I must admit that I have not read the paper yet, but I will try to lay hands on it later today.

I believe that for the post I googled for "CT images brain" and took a public domain result. I do agree though that the image I use looks suspiciously like a T1 contrast MRT image, as can be seen on this website:

https://sites.google.com/a/wisc.edu/neuroradiology/image-acquisition/the-basics

I'll try to investigate.

I do unfortunately not have access to 3D scans of the brain that I can use for this post, but I would love to try to model out in 3D if anyone is willing to donate his/her images.

Thanks for bringing this up.

Cheers,

M.

POSTED BY: Marco Thiel

Hello Marco,

thank you for your - as usual - very interesting post! I will study your code in detail.

For now just a minor remark: The slices you are showing are not from a CT but from a MRT (T1 contrast). In CT images one can not distinguish between white and gray matter.

Cheers, Henrik

POSTED BY: Henrik Schachner

Hello Marco. I am very interested in your example. Based on your images from CT, I tried to get to the area of the boundary condition. But the decision to include it in the ODE I did not get. Perhaps you can help me. Boundary region in the attached document. Thanks in advance!

Attachments:

Sorry for my late reply. I have not had time yet to try this. In the post I basically use the fact that the background is black and therefore blocks the diffusion. I will try to find out how to put this in with the boundary conditions. I have done that on another example so I hope that this is quite possible.

Cheers,

Marco

POSTED BY: Marco Thiel

Dear Jos,

I have just had a look at your code. As I suspected you are trying to use the ImplicitRegion function, which is very powerful and useful, but only works in Mathematica 10 - or in the Cloud.

I have tried your code on Mathematica 10 and it works just fine. It is also much quicker than the Mathematica 9 code. You should have access to the free version of the Wolfram Programming Cloud. If you want you can give it a try and run your code there. It should work.

Best wishes, Marco

POSTED BY: Marco Thiel

Dera Marco,

Thanks for your help. Yes, I will try the code in Wolfram Programming Cloud and when installed next month or in September the new Mathematica 10 version. Best Regards, Jos

POSTED BY: Jos Klaps

Dear Jos,

You are right that the code that I posted uses Mathematica 10 specific commands.

I will have a look at your code. But for the time being, I rewrote the code so that it runs in Mathematica 9 as well. You cannot run the region functions etc. You still need the img2 and img3 images, and then you execute:

sols = Quiet[
  NDSolve[{Div[
       1./500.*(diffcoeff[798.*x, 654*y])^4*
        Grad[u[t, x, y], {x, y}], {x, y}] - D[u[t, x, y], t] + 
      0.025*u[t, x, y] == 0, 
    u[0, x, y] == Exp[-1000. ((x - 0.6)^2 + (y - 0.6)^2)], 
    u[t, 0, y] == 0, u[t, 1, y] == 0, u[t, x, 0] == 0, 
    u[t, x, 1] == 0}, u[t, x, y], {t, 0, 20}, {x, 0, 1}, {y, 0, 1}]]

Plotting works like this:

ImageCompose[img3, {ContourPlot[
   u[t, x, y] /. sols /. t -> 8, {y, 0, 1}, {x, 0, 1}, 
   PlotRange -> {{0, 1}, {0, 1}, {0.01, All}}, PlotPoints -> 100, 
   Contours -> 200, ContourLines -> False, AspectRatio -> 798./654., 
   ColorFunction -> "Temperature"], 0.6}]

Please do refer to the attached notebook as well. Interestingly, I noted a couple of things:

1) The evaluation takes much (!) longer in Mathematica 9. So when you execute the attached notebook you might want to have a cup of tea. 2) I think that I ran the simulation with the same parameters, but the shape of the tumor is slightly different. This might be because of the different integration schemes. So if you want to use this, you need to investigate it. All comments are very welcome.

Here's the frame that corresponds to the one I put up in the original post.

enter image description here

Obviously, the edges are a bit different. The edges correspond to relatively low concentrations however. Also, looking at the frame that describe the progression, everything seems to look a bit different:

enter image description here

Just for the sake of completeness, here is the animation.

enter image description here

I hope that this helps, Marco

Attachments:
POSTED BY: Marco Thiel

Hi Marco, I'm very interesting in this kind of medical problems as brain canser, brain waves, EEG signal processing, etc. I tried to copy and studied your code but it seem not to work on my computer (Mathematica 9). Attached you will find a copy of my code which is based on your input. Please can you let me know what is wrong in my code. Your support will be highly appreciated! Jos

Attachments:
POSTED BY: Jos Klaps
Reply to this discussion
Community posts can be styled and formatted using the Markdown syntax.
Reply Preview
Attachments
Remove
or Discard

Group Abstract Group Abstract