Dear Sam,
I think that indeed such a formula does exist; it will not help a lot, but anyway. In fact there is an infinite number of sequences that fulfil these requirements. Let me construct one, which probably not the one HK wants. First we find an interpolating polynomial:
interpol =
 InterpolatingPolynomial[{105208, 105508, 105637, 105934, 106208,
   106258, 106377, 106769, 107293, 107537}, t]
gives:
105208 + (300 + (-(171/2) + (113/2 + (-(265/12) + (13/3 + (-(1/45) + (-(17/80) + (71/1152 - (487 (-9 + t))/45360) (-8 + t)) (-7 + t)) (-6 + t)) (-5 + t)) (-4 + t)) (-3 + t)) (-2 + t)) (-1 + t)
This polynomial will, by construction, go through all points in your list.
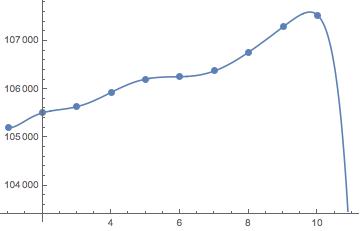
The problem is that if we evaluate the polynomial at integer values the results will not be integers. But we can fix that by applying the Floor function:
Table[Floor[interpol], {t, 1, 13}]
which gives:
{105208, 105508, 105637, 105934, 106208, 106258, 106377, 106769, 107293, 107537, 101918, 55301, -168469}
So that is one solution that fulfils your condition. In fact, you can extend your sequence with any sequence of integers you like such as the first 10 digits of Pi:
seq2 = Join[{105208, 105508, 105637, 105934, 106208, 106258, 106377,
   106769, 107293, 107537}, RealDigits[Pi, 10, 10][[1]]]
then interpolate:
interpol2 = InterpolatingPolynomial[seq2, t]
105208 + (300 + (-(171/
2) + (113/
2 + (-(265/
12) + (13/
3 + (-(1/
45) + (-(17/
80) + (71/
1152 + (-(487/
45360) + (-(20383/
725760) + (71051/
2661120 + (-(535847/
43545600) + (429343/
113218560 + (-(3657119/
4151347200) + (107564393/
653837184000 + (-(457459/
17791488000) + (307472309/
88921857024000 + (-(18670559/45731240755200) + (
61509179 (-19 + t))/1431118828339200) (-18 +
t)) (-17 + t)) (-16 + t)) (-15 + t)) (-14 +
t)) (-13 + t)) (-12 + t)) (-11 + t)) (-10 +
t)) (-9 + t)) (-8 + t)) (-7 + t)) (-6 + t)) (-5 +
t)) (-4 + t)) (-3 + t)) (-2 + t)) (-1 + t)
then plot to check it does the trick:
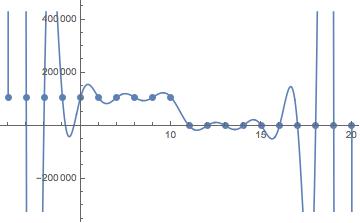
and then generate a list of integers with the help of the Floor function:
Table[Floor[interpol2], {t, 1, Length[seq2] + 2}]
which gives
{105208, 105508, 105637, 105934, 106208, 106258, 106377, 106769,
107293, 107537, 3, 1, 4, 1, 5, 9, 2, 6, 5, 3, 9934449952,
190559866782}
It is quite obvious that this works in principle with any sequence of any length and you can extend it with all sorts of values, i.e. the first
$m$ digits of
$sqrt{2}$, or
$sqrt{5}$, or
$sqrt{7}$.
In fact if you take the first few elements of the Fibonacci sequence:
Table[Fibonacci[n], {n, 1, 12}]
{1, 1, 2, 3, 5, 8, 13, 21, 34, 55, 89, 144}
you get
interpol3 = InterpolatingPolynomial[Table[Fibonacci[n], {n, 1, 12}], t]
1 + (1/2 + (-(1/
6) + (1/12 + (-(1/
40) + (1/
144 + (-(1/
630) + (13/
40320 + (-(1/
17280) + (17/1814400 + (11 - t)/725760) (-10 +
t)) (-9 + t)) (-8 + t)) (-7 + t)) (-6 + t)) (-5 +
t)) (-4 + t)) (-3 + t)) (-2 + t) (-1 + t)
and
Table[Floor[interpol3], {t, 1, 14}]
generates a sequence that is consistent with your list of numbers.
This argument means:
- We have constructed an infinite number of solutions to your problem; most of the solutions will be useless to you.
- Mathematica would be a great help in any IQ test, where you have to construct these sequences. Instead of giving only one solution you can give an infinite number of solutions, even for random sequences. :-)
Cheers,
Marco
PS: Just nit-picking... I fully agree with what you said that we need much more information to attempt to give a useful solution to the problem.


