Your code is almost correct :)
residualPlot[data_, function_, {xmin_, xmax_}, opts : OptionsPattern[]] :=
 Show[ListPlot[{data, Table[{x, function[x]}, {x, data[[All, 1]]}]},
   Filling -> {1 -> {2}}, FillingStyle -> {Red, Green}, PlotMarkers -> {{"*", Large}, ""}, opts],
  Plot[function[x], {x, xmin, xmax}]]
However, once you have defined the function above, let's say:
f[x_] := 3 - .25 x + .125 x^2
there is not need to include it as an argument of the residualPlot function:
residualPlot[data_, {xmin_, xmax_}, opts : OptionsPattern[]] :=
 Show[ListPlot[{data, Table[{x, f[x]}, {x, data[[All, 1]]}]},
   Filling -> {1 -> {2}}, FillingStyle -> {Red, Green}, PlotMarkers -> {{"*", Large}, ""}, opts], Plot[f[x], {x, xmin, xmax}]]
Here is how it works:
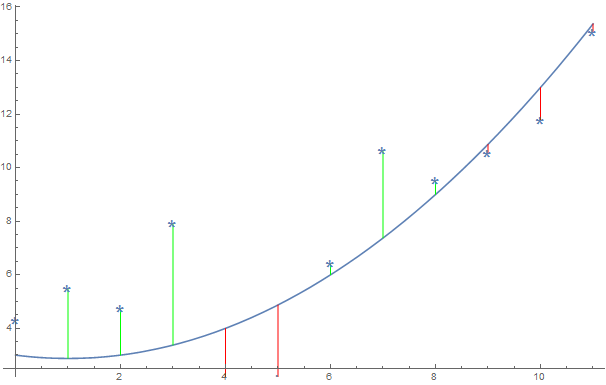
Looks fine, but you may encounter a problem when plotting the same function with data which is not generated from xmin to xmax.
There is a trick which allows you to deal with it without specifying the {ymin, ymax} in the PlotRange - you can just change the places of the plots:
residualPlot[data_, {xmin_, xmax_}, opts : OptionsPattern[]] :=
 Show[Plot[f[x], {x, xmin, xmax}],
  ListPlot[{data, Table[{x, f[x]}, {x, data[[All, 1]]}]}, Filling -> {1 -> {2}},
    FillingStyle -> {Red, Green}, PlotMarkers -> {{"*", Large}, ""}],opts]
then the LogPlot will inherit the "properties" of the first Plot (but now you need to change the "opts" to Plot[], or better to Show[]).


