Recently, Arnoud and Diego have shown how to map interesting data using the Wolfram Language, see Bárðarbunga earthquake swarm, Visualizing the Ebola Outbreak, Mapping Crime Statistics in St. Louis, 13 Years of Crime in Chicago in 1 minute, Analyzing San Fransisco Crime Data, and John Snow's Cholera Map. To import these sets of data, they have used different approaches. In this post I will show how to use the new function Interpreter to obtain crime rates in the US from this Wikipedia table.
crime2012 = Import["http://en.wikipedia.org/wiki/United_States_cities_by_crime_rate#Crime_rates_per_100.2C000_people_.282012.29", "Data"][[1, 1, 3]];
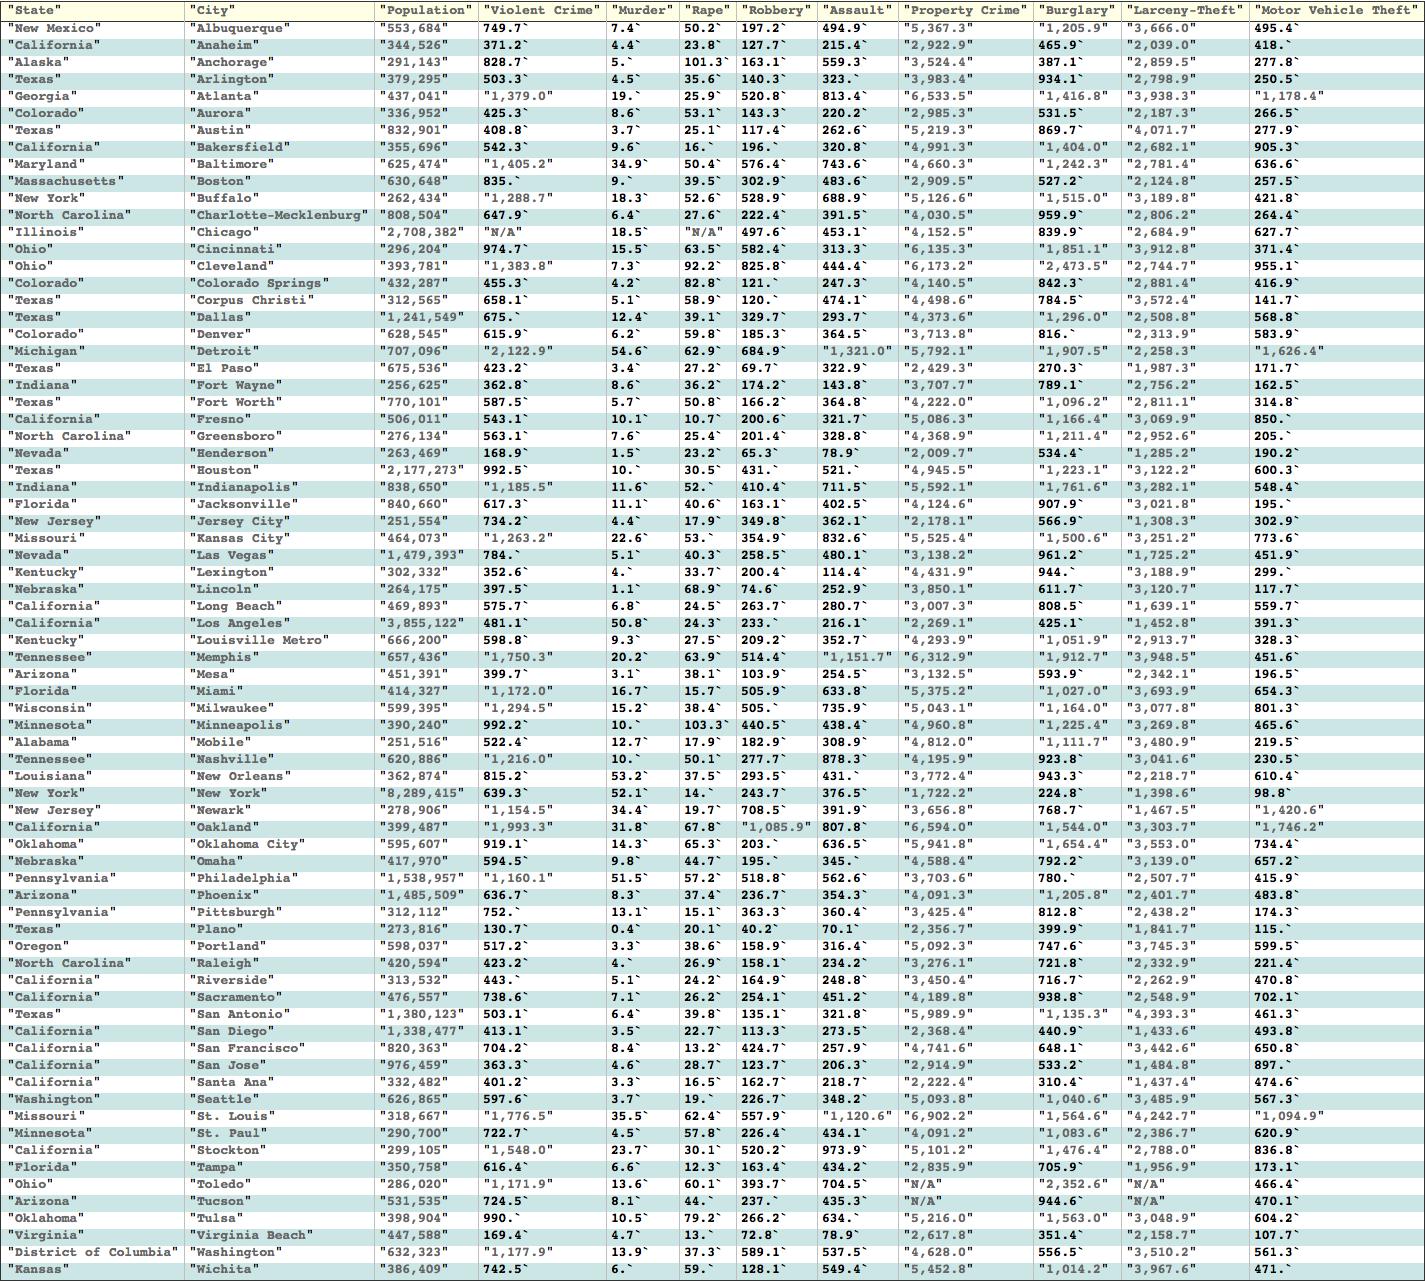
The table lists crime statistics for U.S. cities with a population of 250000 or greater. Rates are based on cases per 100 000 people for all of calendar year 2012. Let's inspect the content using Grid:
Grid[crime2012,
Background -> {None, {Lighter[Yellow, .9], {White, Lighter[Blend[{Blue, Green}], .8]}}},
Dividers -> {{Darker[Gray, .6], {Lighter[Gray, .5]}, Darker[Gray, .6]}, {Darker[Gray, .6], Darker[Gray, .6], {False}, Darker[Gray, .6]}},
Alignment -> Left, ItemSize -> Full]
Now we will force the Wolfram Language to interpret this data correctly using a new MMA 10 function: Interpreter. For example 553,684 has been interpreted as a string with a comma "553,684", let's fix this as follows:
Interpreter["Number"]["553,684"]
553684
To interpret the cities as entities we will use Interpreter as well:
Interpreter["City"]["Albuquerque" <> " " <> "New Mexico"]

To parse all this data we create the following function that applies interpreters to the cases list:
crimeCities[{state_, city_, population_, violentCrime_, murder_, rape_, robbery_, aggravatedAssault_, propertyCrime_, burglary_, larceny_, motorVehicle_}] := {
Interpreter["City"][ city <> " " <> state],
Interpreter["Number"][population],
Interpreter["Number"][violentCrime],
Interpreter["Number"][murder],
Interpreter["Number"][rape],
Interpreter["Number"][robbery],
Interpreter["Number"][aggravatedAssault],
Interpreter["Number"][propertyCrime],
Interpreter["Number"][burglary],
Interpreter["Number"][larceny],
Interpreter["Number"][motorVehicle]}
And then we Map this function to the table:
data = crimeCities[#] & /@ Drop[crime2012, 1]
Finally, we can get rid of the interpreter's Failures using DeleteCases and Cases:
crime = Cases[ DeleteCases[ data, {_Failure, _, _, _, _, _, _, _, _, _, _}], {_, _, _Real, _Real, _Real, _Real, _Real, _Real, _Real, _Real, _Real}]
Mapping Crime Rates in the US
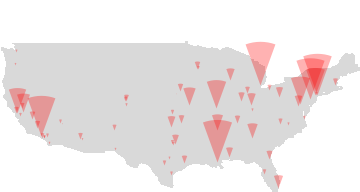
Once this data has been cleaned up, it's quite straightforward to map crime rates all over the US. The following piece of code generates a list with the cities paired with the normalized murder rates:
murders = Transpose[{Transpose[crime][[1]], Normalize[Transpose[crime][[4]]]}];
Now we can Map this list as follows:
Graphics[{LightGray, CountryData["UnitedStates", "Polygon"],
Opacity[0.3, Red], Disk[Reverse[CityData[#[[1]], "Coordinates"]], 20. #[[2]], {110 Degree, 70 Degree}] & /@ murders},
PlotRange -> {{-67, -125}, { 56, 25}}]
Let's add Tooltips to the infographic:
Graphics[{LightGray, CountryData["UnitedStates", "Polygon"],
Opacity[0.3, Red], Tooltip[Disk[Reverse[CityData[#[[1]], "Coordinates"]], 20. #[[2]], {110 Degree, 70 Degree}], #[[1]] -> 100. #[[2]]] & /@ murders},
PlotRange -> {{-67, -125}, { 56, 25}}]
Finally we can create a simple Manipulate that allows us to select the type of crime:
Manipulate[ Graphics[{LightGray, CountryData["UnitedStates", "Polygon"],
Opacity[0.3, Red], Tooltip[Disk[Reverse[CityData[#[[1]], "Coordinates"]], 20. #[[2]], {110 Degree, 70 Degree}], #[[1]] -> 100. #[[2]]] & /@ Transpose[{Transpose[crime][[1]], Normalize[Transpose[crime][[i]]]}]},
PlotRange -> {{-67, -125}, { 56, 25}}],
{{i, 2, "Type"}, {2 -> "Population", 3 -> "Violent Crime", 4 -> "Murder", 5 -> "Rape", 6 -> "Robbery", 7 -> "Aggravated Assault", 8 -> "Property Crime", 9 -> "Burglary", 10 -> "Larceny", 11 -> "Motor Vehicle Theft"}}]