Hi Greg,
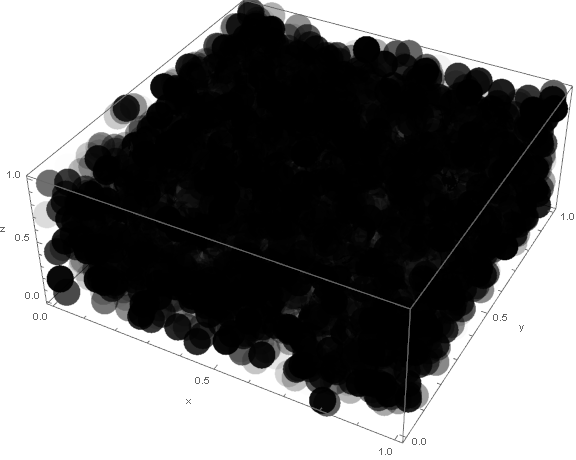
A few issues. You got 4 points above because the data was 4 x 4000 - it needed to be transposed. The other issue is how the plot routines like ListPointPlot3D apply PlotStyles. They are all set to accept a list of lists for plotting multiple plots in the same graphic. So a PlotStyle list is applied one item per plot, not each point. You can apply a list of styles to a list of points by making each point into a 1-element list. So for 1000 points we are really plotting 1000 plots, each with its own style. Each plot has exactly one point.
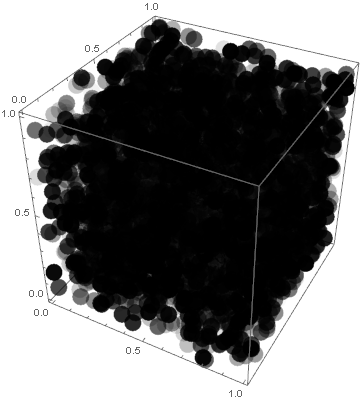
You can also get around this by simply constructing your own graphics from primitives. Note especially the convenient use of pattern-base rules for transforming the data. It is often much easier and more readable that pure functions.
In[1]:= (* this data needs to be transposed *)
data = {Table[RandomReal[], {i, 1, 4000, 1}],
    Table[RandomReal[], {i, 1, 4000, 1}],
    Table[RandomReal[], {i, 1, 4000, 1}],
    Table[RandomReal[], {i, 1, 4000, 1}]} // Transpose;

In[2]:= data // Dimensions

Out[2]= {4000, 4}

In[3]:= (* Using ListPointPlot3D *)

In[4]:= (* include point size and color in each sublist *)
pointsOpacity = {PointSize[0.05], Black, Opacity[#]} & /@
   data[[;; , 4]];

In[5]:= pointsOpacity[[1]]

Out[5]= {PointSize[0.05], GrayLevel[0], Opacity[0.610006]}

In[6]:= (* another way to transorm data -- each point in its own \
sublist *)
data1 = data /. {x_, y_, z_, o_} -> {{x, y, z}};

In[7]:= Timing[
 Show[ListPointPlot3D[data1, PlotStyle -> pointsOpacity,
   AxesLabel -> {"x", "y", "z"}], ImageSize -> Large]
 ]

(* from primitives *)
points = data /. {x_, y_, z_, op_} -> {PointSize[0.05], Opacity[op],
     Point[{x, y, z}]};

Show[Graphics3D[points], Axes -> True]

 Attachments: