Jos,
Here is a solution I made using the Presentations package ($50) which I sell through my web site.
<< Presentations`
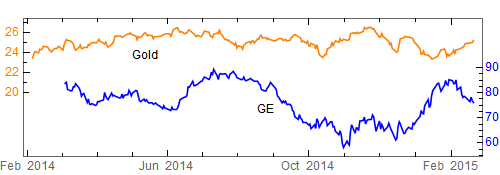
list1 = FinancialData["GE", "Feb. 5, 2014"];
list2 = FinancialData["Gold", "March. 5, 2014"];
For plotting, I scale up the gold price by a factor of 4. (Is that actually the gold price?)
list1a = list1 /. {date : {__}, price_} :> {date, 4 price};
Then I make custom ticks for GE, Gold and also for the dates. With Presentations we can treat everything as a graphics primitive and just draw them, one after another, in one plot.. So the following draws the plot:
dateticks =
  CustomDateTicks[{{2014, 2}, {2015, 2}, {4, "Month"}, 4},
   DateString[#, {"MonthNameShort", "  ", "Year"}] &];
goldticks =
  CustomTicks[4 # &, {20, 30, 2, 2},
   CTNumberFunction -> (Style[#, ColorData["Legacy"]["Orange"]] &)];
geticks =
  CustomTicks[Identity, {50, 90, 10, 4},
   CTNumberFunction -> (Style[#, Blue] &)];

Draw2D[
 {DateListDraw[list1a, PlotStyle -> Orange],
  DateListDraw[list2, PlotStyle -> Blue],
  Text["Gold", {3.609*^9, 95}],
  Text["GE", {3.618*^9, 73.34}]},
 AspectRatio -> 0.3,
 Frame -> True,
 FrameTicks -> {{goldticks, geticks}, {dateticks,
    dateticks // NoTickLabels}},
 BaseStyle -> {FontSize -> 12},
 ImageSize -> 500]