Message Boards Message Boards

0
|
6420 Views
|
6 Replies
|
0 Total Likes
View groups...
Share
Share this post:

TwoAxisListPlot not working

Posted 10 years ago

Hi Mathematica Users, Does anyone know why TwoAxisPlot are not working?

list1 = FinancialData["GE", "Feb. 5, 2014"];
list2 = FinancialData["Gold", "March. 5, 2014"];
TwoAxisDateListPlot3[list1, list2, AspectRatio -> 0.3, 
  ImageSize -> Large];

Looking forward to your reply ! Jos

POSTED BY: Jos Klaps
6 Replies

Hi there,

It is difficult to help. TwoAxisDateListPlot3 or TwoAxisPlot are not Mathematica functions, so they cannot evaluate unless you have defined them yourself earlier. If you have defined the functions earlier, it would help to get their definitions.

Cheers,

M.

POSTED BY: Marco Thiel

Thanks for your quick reply. I'm working on a number of plots and need two axis (y1 and y2), but I can't find the right code. I can use the 'Overlay' function but the function 'ImagePadding' are not matching in different types of plots. Are other funtions available ? My example comes from internet and can't remember the link anymore. See file attached.

Attachments:
POSTED BY: Jos Klaps

Hi Marco, Thanks for your help. Jos

POSTED BY: Jos Klaps

Jos,

Here is a solution I made using the Presentations package ($50) which I sell through my web site.

<< Presentations`
list1 = FinancialData["GE", "Feb. 5, 2014"];
list2 = FinancialData["Gold", "March. 5, 2014"];

For plotting, I scale up the gold price by a factor of 4. (Is that actually the gold price?)

list1a = list1 /. {date : {__}, price_} :> {date, 4 price};

Then I make custom ticks for GE, Gold and also for the dates. With Presentations we can treat everything as a graphics primitive and just draw them, one after another, in one plot.. So the following draws the plot:

dateticks = 
  CustomDateTicks[{{2014, 2}, {2015, 2}, {4, "Month"}, 4}, 
   DateString[#, {"MonthNameShort", "  ", "Year"}] &];
goldticks = 
  CustomTicks[4 # &, {20, 30, 2, 2}, 
   CTNumberFunction -> (Style[#, ColorData["Legacy"]["Orange"]] &)];
geticks = 
  CustomTicks[Identity, {50, 90, 10, 4}, 
   CTNumberFunction -> (Style[#, Blue] &)];

Draw2D[
 {DateListDraw[list1a, PlotStyle -> Orange],
  DateListDraw[list2, PlotStyle -> Blue],
  Text["Gold", {3.609*^9, 95}],
  Text["GE", {3.618*^9, 73.34}]},
 AspectRatio -> 0.3,
 Frame -> True,
 FrameTicks -> {{goldticks, geticks}, {dateticks, 
    dateticks // NoTickLabels}},
 BaseStyle -> {FontSize -> 12},
 ImageSize -> 500]
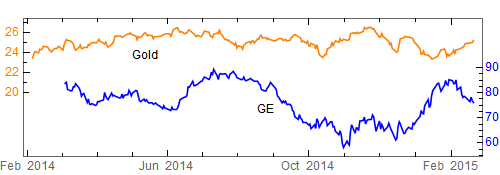
enter image description here

Hi David, Thanks for your and to let me know.

Cheers Jos

POSTED BY: Jos Klaps
Reply to this discussion
Community posts can be styled and formatted using the Markdown syntax.
Reply Preview
Attachments
Remove
or Discard

Group Abstract Group Abstract