The Excel sheet has only column A filled. Import it
In[1]:= x = Import["N:\\Udo\\Abt_N\\help.xlsx"];
strip trash off
In[3]:= Clear[y]
        y = Most[Rest[Flatten[x]]]
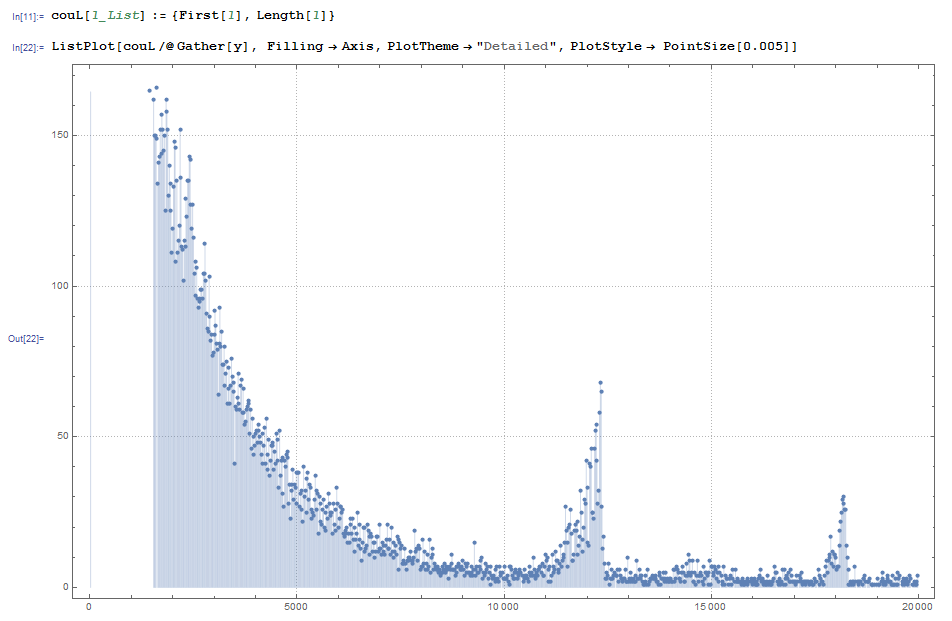
plot
In[11]:= Clear[couL]
         couL[l_List] := {First[l], Length[l]}

In[22]:= ListPlot[couL /@ Gather[y], Filling -> Axis, PlotTheme -> "Detailed", PlotStyle -> PointSize[0.005]]

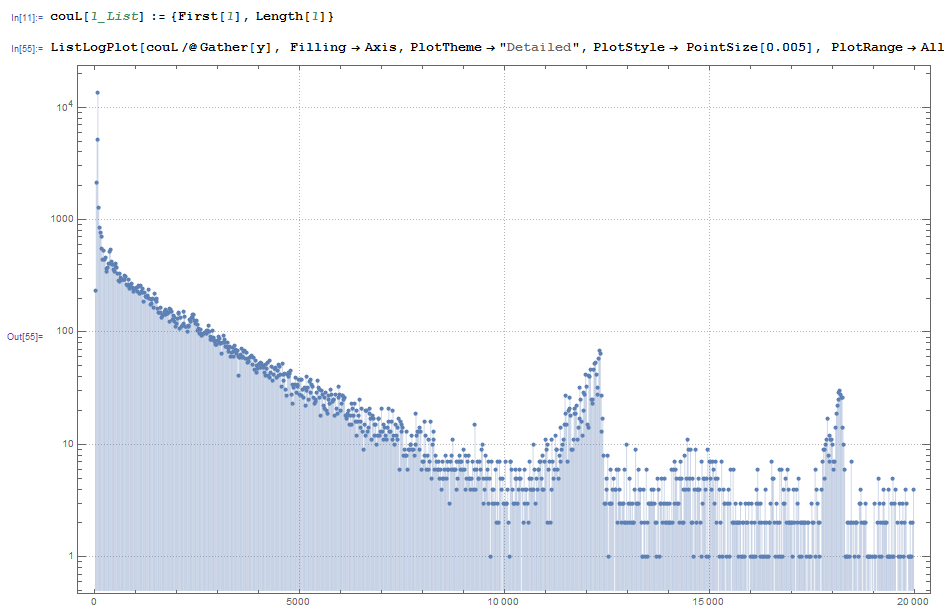
A ListLogPlot shows also the beginning

Because not every point (step width 20) has a value,
In[36]:= Complement[Range[999], Rationalize /@ ((First /@ Gather[y])/20)]
Out[36]= {497, 521, 634, 761, 770, 777, 796, 799, 829, 855, 869, 874, \
          878, 886, 925, 931, 937, 942, 946, 948, 950, 954, 978, 979, 985, 991, 992}
for a histogram plot you need to introduce zeroes at such points. This is done by
In[61]:= Last /@
  SortBy[Join[couL /@ Gather[y],
    Transpose[{Complement[20 Range[999],
       Rationalize /@ (First /@ Gather[y])], ConstantArray[0, 27]}]],
   First] // Short

Out[61]//Short= {234, 2158, 5146, 13542, 1285, 855, 768, 703, 548, 443,
     529, 443, 460, 347, 368, 372, 405, 522, 546, <<961>>, 1, 3, 1, 2, 0, 3,
     1, 2, 4, 3, 0, 0, 1, 1, 2, 1, 1, 2, 4}