Group Abstract Group Abstract

Message Boards Message Boards

0
|
9.4K Views
|
11 Replies
|
3 Total Likes
View groups...
Share
Share this post:

Lifetime of muon decay frequencies histogram plot

Posted 11 years ago

I have spent almost 10 hours trying to get a proper histogram plot from raw data. It is a huge amount of data (60000 entries) and many of the entries repeat themselves. I need to put the repetitive numbers in a bins and then graph their frequencies against the actual values. I also need to find the slope of the data. FYI, I am trying to find the lifetime of muon decay, if any of you are familiar with the experiment. I have been frustrated so far with petty error messages and slow computation due to the huge amount of data. The deadline for the lab report is tomorrow and I need the numerical analysis as soon as possible. If someone could do the above for me and repost it, I will be eternally grateful!! I have a attached a file with the raw data!

Attachments:
POSTED BY: Mustafa Ibrahim
11 Replies

Henric and Marco you are absolutely right, this indeed looks like a homework assignment. We kept this thread because Udo posted a nice response. But it indeed would be much better if frequent power members (like everyone here) would "Flag" the post with a short message that a post is potentially a blunt homework, - restraining from a response. Then we would catch it in time. We will lock this thread. Please feel free to discuss this subject in the Wolfram Community group.

Thank you very much for your amazing contributions, patience and support.

POSTED BY: EDITORIAL BOARD

Hi all, hi ModerationTeam,

I was thinking about posting an answer, but I did not dare to do so. To me this looks too much like annother homework problem ...

Henrik

POSTED BY: Henrik Schachner

Hi,

yes, after being told off last time for answering a suspected homework problem I am also now much more careful when to try to help. I have already passed on several questions because of that.

Marco

POSTED BY: Marco Thiel
Posted 11 years ago
POSTED BY: Bill Simpson

I cannot imagine a less informative suibject header.

POSTED BY: Daniel Lichtblau

How about: Arrgghhh?

POSTED BY: Udo Krause

I said I could not imagine a less informative subject header. I didn't say you couldn't...

POSTED BY: Daniel Lichtblau

Oh, thank you!

POSTED BY: Udo Krause
Posted 11 years ago

Thanks a lot guys! I am sorry for the badly worded title. I am going to try and replicate your results, and I will let you know how it goes! Thanks again!

POSTED BY: Mustafa Ibrahim
Posted 11 years ago

How do I get the slope?

POSTED BY: Mustafa Ibrahim

The Excel sheet has only column A filled. Import it

In[1]:= x = Import["N:\\Udo\\Abt_N\\help.xlsx"];

strip trash off

In[3]:= Clear[y]
        y = Most[Rest[Flatten[x]]]

plot

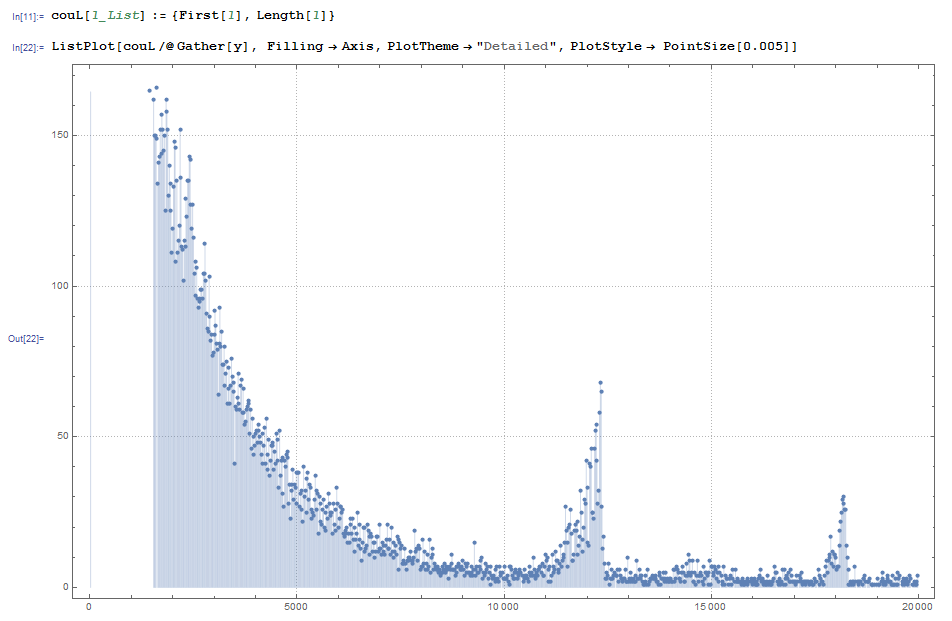
In[11]:= Clear[couL]
         couL[l_List] := {First[l], Length[l]}

In[22]:= ListPlot[couL /@ Gather[y], Filling -> Axis, PlotTheme -> "Detailed", PlotStyle -> PointSize[0.005]]

count list plot

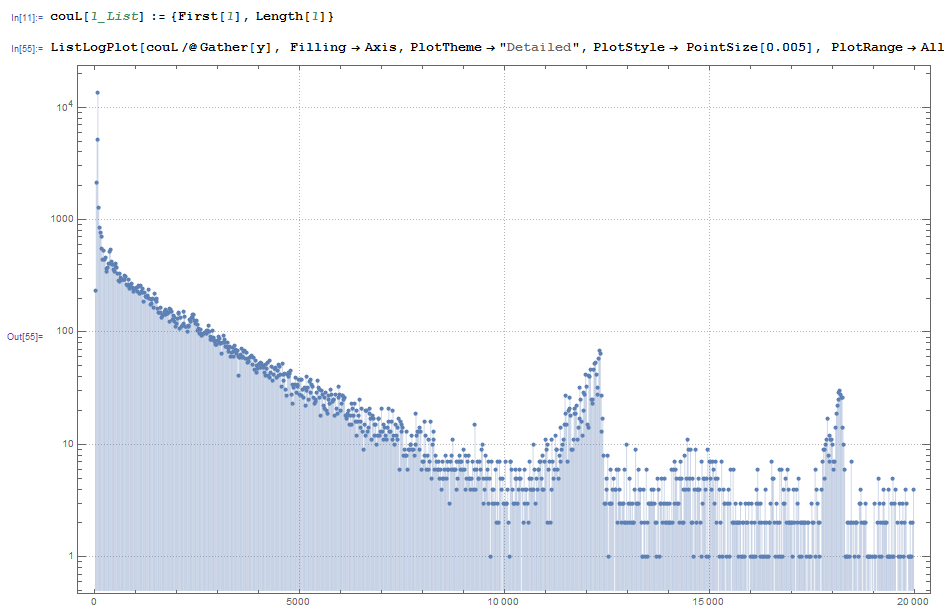
A ListLogPlot shows also the beginning

count ListLogPlot

Because not every point (step width 20) has a value,

In[36]:= Complement[Range[999], Rationalize /@ ((First /@ Gather[y])/20)]
Out[36]= {497, 521, 634, 761, 770, 777, 796, 799, 829, 855, 869, 874, \
          878, 886, 925, 931, 937, 942, 946, 948, 950, 954, 978, 979, 985, 991, 992}

for a histogram plot you need to introduce zeroes at such points. This is done by

In[61]:= Last /@ 
  SortBy[Join[couL /@ Gather[y], 
    Transpose[{Complement[20 Range[999], 
       Rationalize /@ (First /@ Gather[y])], ConstantArray[0, 27]}]], 
   First] // Short

Out[61]//Short= {234, 2158, 5146, 13542, 1285, 855, 768, 703, 548, 443,  
     529, 443, 460, 347, 368, 372, 405, 522, 546, <<961>>, 1, 3, 1, 2, 0, 3, 
     1, 2, 4, 3, 0, 0, 1, 1, 2, 1, 1, 2, 4}
POSTED BY: Udo Krause