Use the new built-in Plotlegends capability. (Not to be confused with the old PlotLegend package.) I am sure you could work this to an identical form, but here is something which is perhaps suitable:
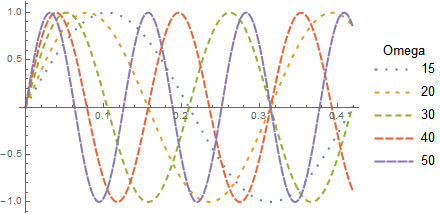
omegaValues = {15, 20, 30, 40, 50};

plt = Plot[
  Table[Sin[omega x], {omega, omegaValues}] // Evaluate, {x, 0,
   2 Pi/First[omegaValues]},
  PlotStyle ->
   Table[{Thick, Dashing[.03 {k, 1 - k}]}, {k, .2, 1, .2}],
  PlotLegends -> LineLegend[omegaValues, LegendLabel -> "Omega"]]