A first interesting observation. We have an interesting and for now experimental function FindDistribution When it ran on various parts of data it suggests that data are distributed according to WeibullDistribution or LogNormalDistribution distributions. And guess what? This are the usual suspects for wind speed distributions, for example see:
Mixture probability distribution functions to model wind speed distributions
Please do not post of issues with FindDistribution here - it is marked EXPERIMENTAL in documentation and under development
Still FindDistribution works very nicely. Some insights are below. The data diff are taken from the post above.
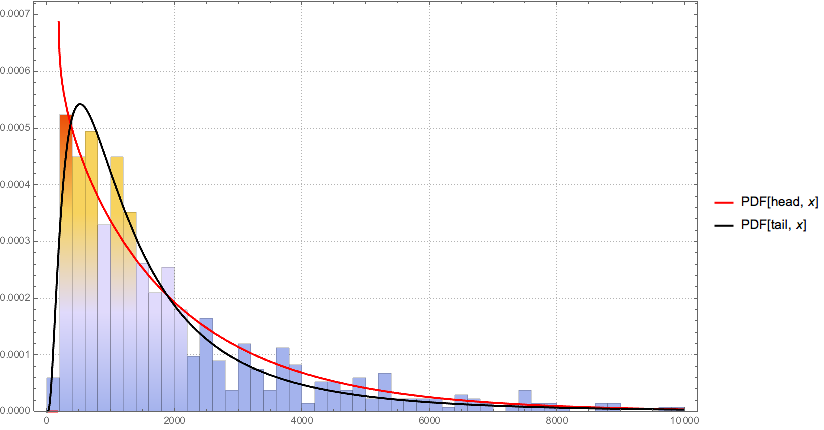
head = FindDistribution[diff[[;; 400]]]
WeibullDistribution[0.952215, 1868.28, 180.648]
tail = FindDistribution[diff[[400 ;;]]]
LogNormalDistribution[7.10678, 0.923829]
his = Histogram[diff, 60, "ProbabilityDensity",
   ChartElementFunction -> "GradientScaleRectangle", PlotTheme -> "Detailed"];

plo = Plot[{PDF[head, x], PDF[tail, x]}, {x, 0, 10000},
   PlotStyle -> {Directive[Thick, Red], Directive[Thick, Black]},
   PlotRange -> All, PlotTheme -> "Detailed"];

Show[his, plo, ImageSize -> 700, PlotRange -> {{1, 10000}, All}]