Great post! Let's see how old the artists were when they created these masterpieces.
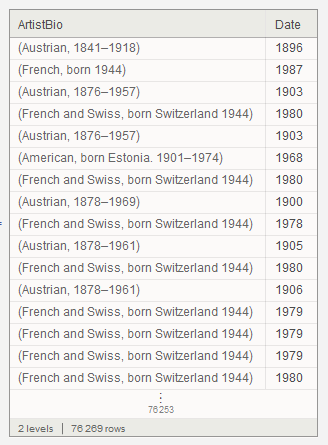
First, I'll pick out the columns for the artist's bio and the painting date, and filter out works without a date entry:
bioanddate=moma[All,{"ArtistBio","Date"}][Select[NumericQ[#Date]&]]
Which gives us this:
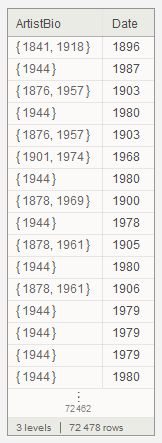
The date column looks good, but we have to extract the year of birth from the ArtistBio column. This column is formatted differently for different artists, so I'll try a bit of a brute-force approach. The next piece of code splits the ArtistBio entries into words and years and selects everything that is a number:
yearsanddate=bioanddate[All,{"ArtistBio"->(Select[
StringSplit[#,{" ","\[Dash]",",","(",")"}], (!TrueQ[#==""]&&SubsetQ[CharacterRange["0","9"],
Characters[#]])&]&),"Date"->Identity}][Select[#ArtistBio!={}&]]
And we have:
From this dataset, we want the first entry of the ArtistBio column (assuming that even artists are born before they die), and the second column:
Histogram[-Subtract@@@Values[Normal[yearsanddate[All,{"ArtistBio"->(ToExpression[#[[1]]]&),
"Date"->Identity}]]],PlotTheme->{"Detailed","Large","LargeLabels"}]
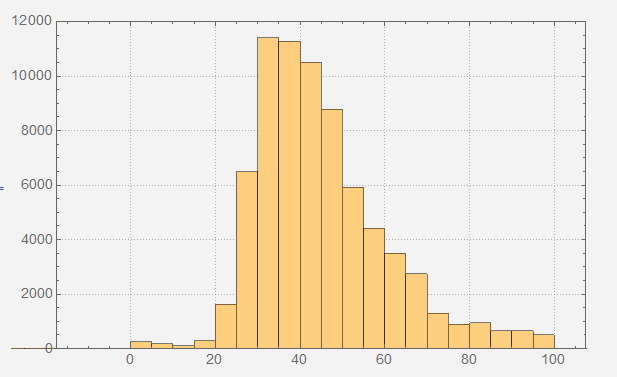
I'll assume that the single-digit ages are possibly artifacts (pun definitely intended), so you could hunt those down if you like. Overall it looks like there is a fair share of pretty young artists. (Keep in mind that paintings from older artists are quite likely not their first work - Vitaliy already found that some artists at the MoMa are quite prolific.)
Something similar could be done for country of origin just to see how international the MoMa is. Which leads us to oddly specific questions such as the correlation between most prolific age and country of birth. (Although the results would be severely influenced by any purchase bias the MoMa may have, consciously or otherwise.)


