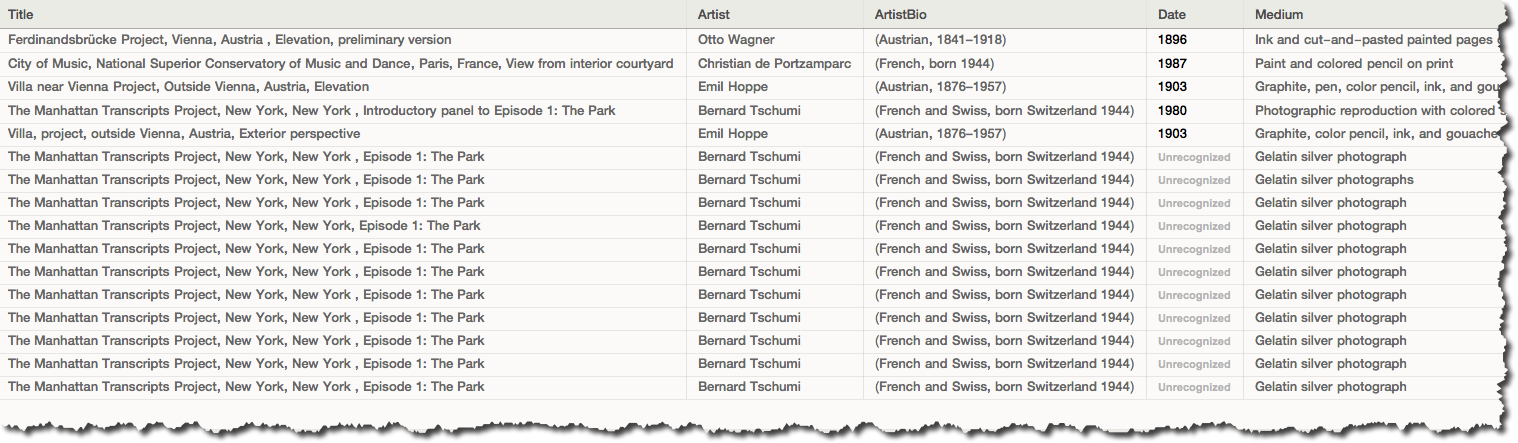
I have recently visited MoMa (The Museum of Modern Art) in New York City, I always keep coming back there. To my surprise they have recently created an official MoMa GitHub account hosting data of their art collection, some basic metadata for each work, including title, artist, date made, medium, dimensions, and date acquired by the Museum.
How can we visualize and process MoMa data? What could we learn from this dataset? - please share your ideas
Below a simple stab at the topics of titles of the dataset.
Import data:
moma = SemanticImport["https://raw.githubusercontent.com/MuseumofModernArt/collection/master/Artworks.csv"]
Get the titles colum:
titles = Normal[moma[All, "Title"]];
Make single string, DeleteStopwords, get TextWords and remove all words shorter than 4 characters. Build WoedCloud:
str = StringJoin[titles];
words = TextWords[DeleteStopwords[str]];
filt = Select[words, StringLength[#] > 3 &];
WordCloud[filt]

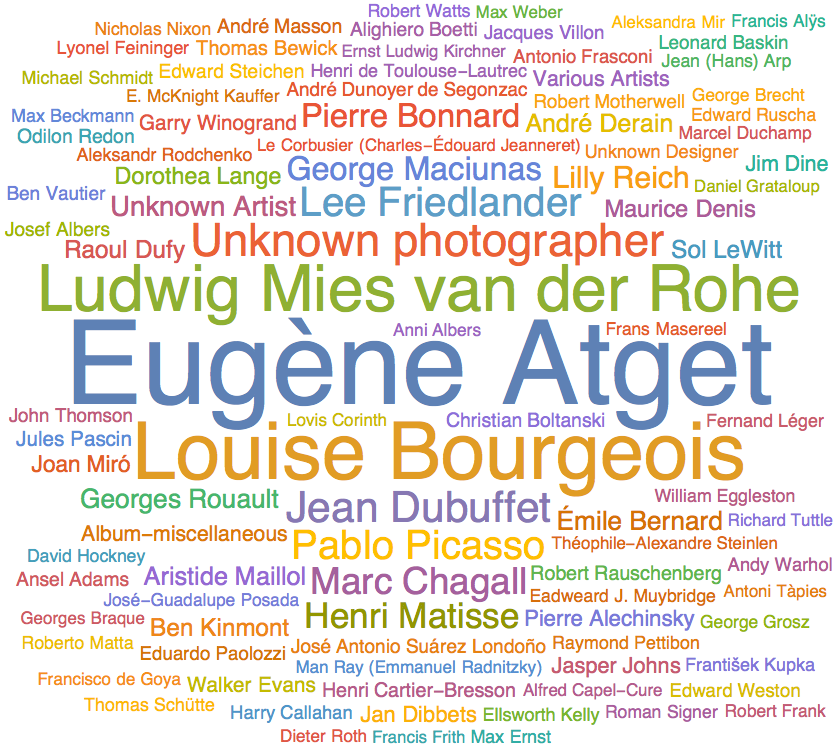
Hmmm.. I just have realized i can check who are most popular artists in the collection:
artist = Normal[moma[[All, "Artist"]]];
WordCloud[artist]
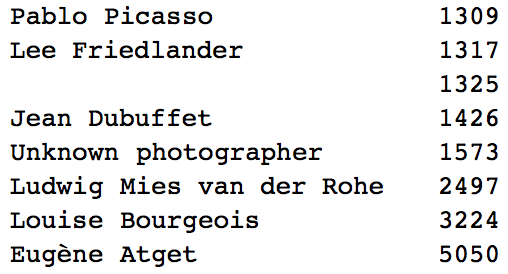
So the 8 top runners are:
leads = Sort[Tally[artist], #1[[2]] < #2[[2]] &][[-8 ;;]];
leads // TableForm
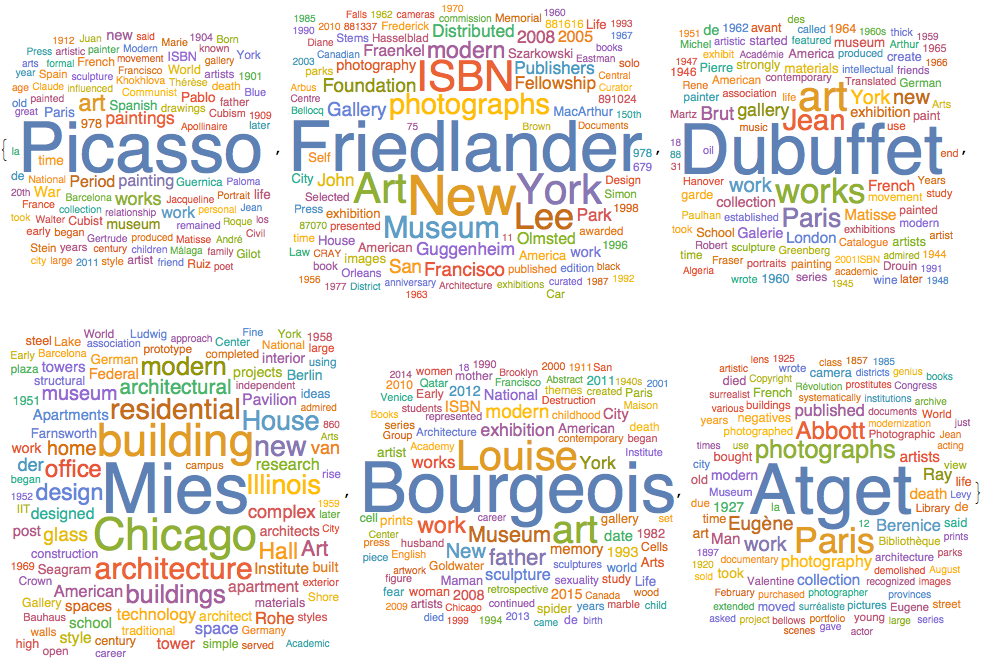
And now clouds about people in the cloud ;-) with WikipediaData (skipping unknown and blank):
WordCloud[DeleteStopwords[WikipediaData[#]]] & /@ leads[[All, 1]][[{1, 2, 4, 6, 7, 8}]]
Update due to Michael's comment below:
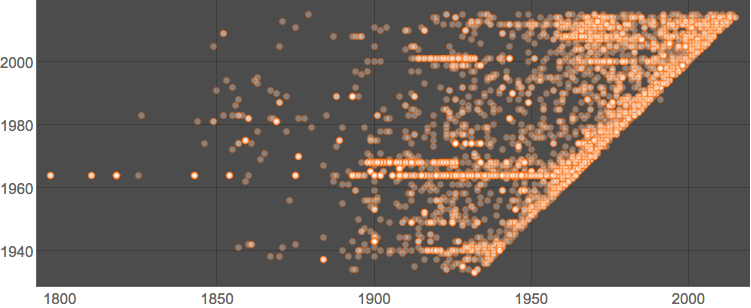
Michael, thanks for the link. I really liked the idea of "modern" in MoMa. If this is a museum of "modern" art then it should modernize its collection pretty quickly moving with the step of time. In the dataset we infromation about dates of the creation (by artist) and acquisition (by MoMa) of the art. I got this visuals to inform us (points are creation-acquisition years pairs ):
Now what are they and how to build them. But we will have to clean the data. Lets use regular import now:
moma = Import["https://raw.githubusercontent.com/MuseumofModernArt/collection/master/Artworks.csv"];
The length of an entry is 14
Length@moma[[1]]
14
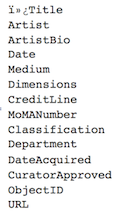
for exactly these categories:
moma[[1]] // Column
So out of
moma // Length
137382
entries we keep only ones of the length 14 to avoid missing date entries:
momaLE = Select[moma[[2 ;; -1]], Length[#] == 14 &];
momaLE // Length
112407
Now we get only columns 4 and 11 for creation and acquisition dates. And turn everything to strings:
momaDaStr = ParallelMap[ToString, momaLE[[All, {4, 11}]], {2}];
so out of the form
momaDaStr[[;; 6]]
{{"1896", "1996-04-09"}, {"1987", "1995-01-17"}, {"1903", "1997-01-15"}, {"1980", "1995-01-17"}, {"1903", "1997-01-15"}, {"1976-77", "1995-01-17"}}
it is easy just to grab first 4 characters of the year only (but first we have to get only those strings which are at least 4 characters):
momaYear = Select[momaDaStr, StringLength[#[[1]]] > 3 && StringLength[#[[2]]] > 3 &];
yeye = ParallelMap[StringTake[#, 4] &, momaYear];
Now get only number-strings and turn them into numbers:
numb = Select[yeye, StringMatchQ[#[[1]], NumberString] && StringMatchQ[#[[2]], NumberString] &];
pairs = ToExpression[ numb];
Alas we left with only:
pairs // Length
86987
entries. Still a lot. Taking random sample of a few 1000s of entries makes a better visual:
ListPlot[RandomSample[pairs, 5000], PlotTheme -> "Marketing",
 BaseStyle -> 15, PlotStyle -> Opacity[.3], AspectRatio -> Automatic]
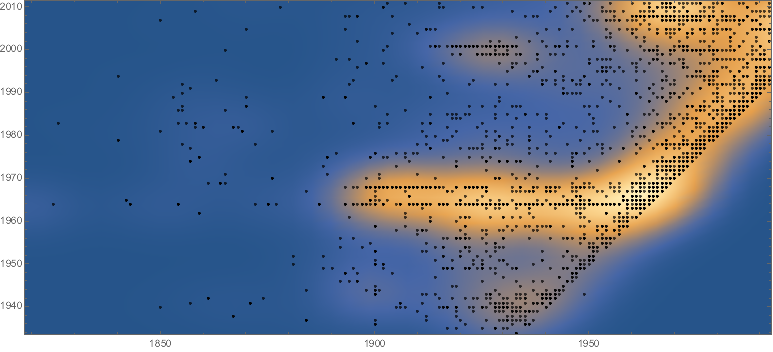
But perhaps we need to see where the most points are concentrated so we use smooth kernel distribution and indeed a lot of entries line up tight to the 1-to-1 correspondence between acquisition and creation dates, that's the slanted edge:
Show[
   SmoothDensityHistogram[#, PlotRangePadding -> 0,  GridLines -> Automatic],
   Graphics[{Opacity[.7], Point[#]}],
   AspectRatio -> Automatic] &@RandomSample[pairs, 5000]
We can compute average delay in acquisition - it is about 30 years:
-Subtract @@@ pairs // Mean // N
27.53
What do we do next?


