Message Boards Message Boards

Why is Histogram so slow?

Posted 9 years ago

This is a suggestion/request to speed up Histogram.

Histogram is ridiculously slow compared to what it could be. Consider just this simple example:

In[156]:= data = RandomReal[1, 5000000];

In[157]:= BinCounts[
   data,
   0.1
   ]; // AbsoluteTiming

Out[157]= {0.069129, Null}

In[158]:= HistogramList[
   data,
   {0.1}
   ]; // AbsoluteTiming

Out[158]= {14.6606, Null}

In[159]:= Tally@Quotient[data, 0.1]; // AbsoluteTiming

Out[159]= {0.038678, Null}

Histogram is 150 times slower than BinCounts. Going from BinCounts to a good quality figure is not at all trivial. It might not be difficult but it certainly takes time. Dealing with this shortcoming of Histogram is often a significant time waster.

I understand that Histogram can do lot more than BinCounts, but in the most common use case it just doesn't have to. In this example above they do the exact same thing. Histogram should have special case optimizations for the most common use case.

Please fix Histogram.

POSTED BY: Szabolcs Horvát
4 Replies

Thanks for bringing it up, we will look into it.

POSTED BY: Moderation Team

I fully support this, I simply don't use Histogram (or only when I have <1000 points). I always use BinCounts and feed it in to ListPlot.

What I did find, is that Histogram is already a lot faster if you explicitly tell the upper and lower bounds. With the specification of {0.1}, the 'offset' has a degree of freedom, by eliminating it, it is a lot faster...

HistogramList[data, {0.1}]; // AbsoluteTiming
HistogramList[data, {Min[data], Max[data], 0.1}]; // AbsoluteTiming

{17.6222, Null}
{1.91047, Null}

For me the ratio is more like 200 btw...

POSTED BY: Sander Huisman

That's a good tip, thank you! It does indeed speed it up.

For personal use, I also use ListPlot. But when I show those plots to others, I get increasingly common complaints that they are not readable enough, etc. Thus I am compelled to produce a barchart-style thing.

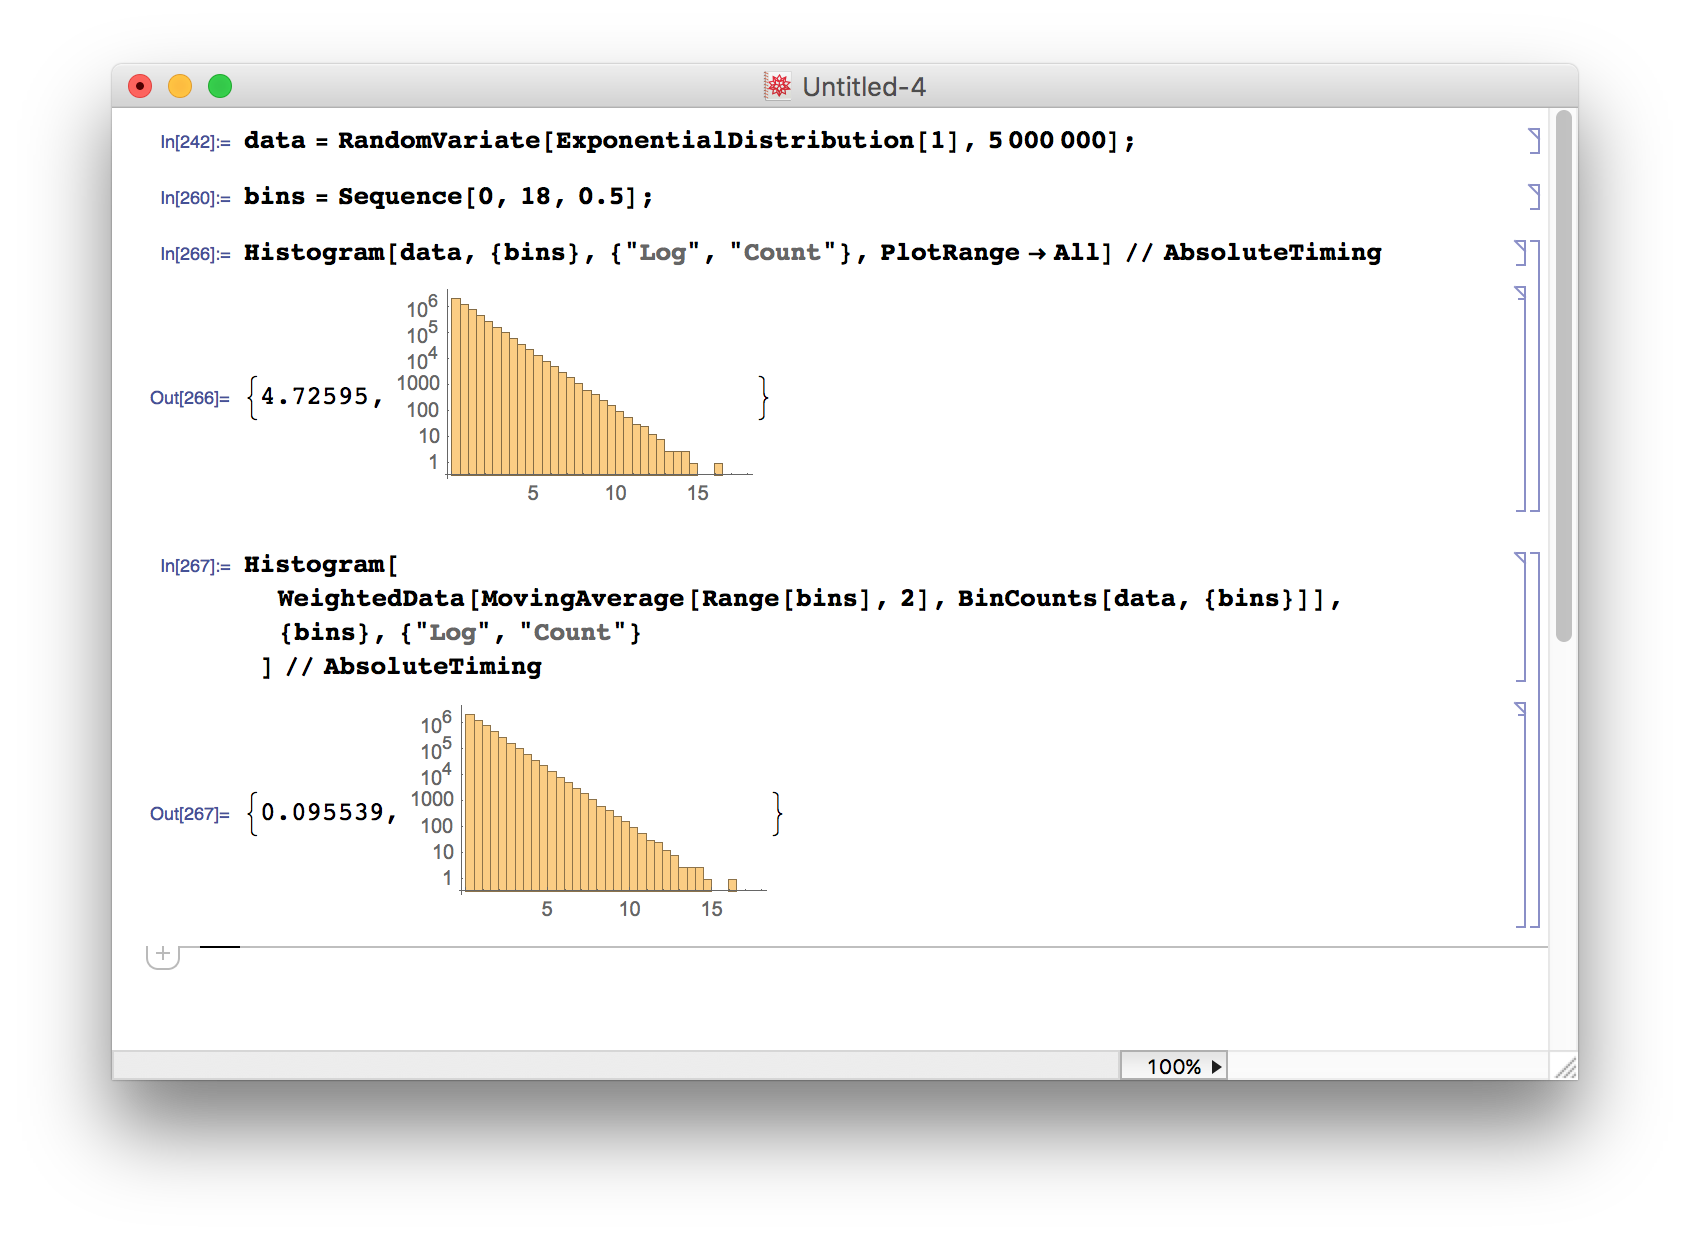
In the meantime I found this suggestion to use WeightedData. One need to take special care to line up the bins carefully between the steps of the procedure, but this works:

data = RandomVariate[ExponentialDistribution[1], 5000000];

bins = Sequence[0, 18, 0.5];

Histogram[data, {bins}, {"Log", "Count"}, 
  PlotRange -> All] // AbsoluteTiming

Histogram[
  WeightedData[MovingAverage[Range[bins], 2], BinCounts[data, {bins}]],
  {bins}, {"Log", "Count"}
  ] // AbsoluteTiming

enter image description here

Luckily it doesn't prevent me from using logarithmic vertical scaling easily

POSTED BY: Szabolcs Horvát

A good quick solution, but seems like quite a `hack' haha, should be more user friendly in my opinion, Now you still use Bincounts to do all the actual work, and (with just a few weighted datapoints) do the Histogram... neat but cumbersome I would say...

POSTED BY: Sander Huisman
Reply to this discussion
Community posts can be styled and formatted using the Markdown syntax.
Reply Preview
Attachments
Remove
or Discard

Group Abstract Group Abstract