Message Boards Message Boards

1
|
13093 Views
|
5 Replies
|
4 Total Likes
View groups...
Share
Share this post:

Graphs with multiple edges and problems with edges layouts and colouring

Posted 9 years ago

In trying to plot a graph, I came across a serious inconvenience with styling and plotting edges which seems a bit odd and pretty unexpected.

The documentation (Help) says, and we knew, that the last style specification overrides the previous. But there is nothing in the Help about the fact that multiple edges between two vertices are considering to be unique (just one edge, just the same) for some purposes and not for others. As the issue is hard to explain in plain text, I have attached one notebook which presents the problem in some detail. The notebook is a bit redundant, a bit colourful, and perhaps inelegant and baroque, but has been made so in purpose to fully explain what happens; or, at least, which is the difficulty I am facing.

It seems that the multiple edges feature has been released uncompleted and without warning on this issue. Or perhaps it is just a bug. The issue conveys a lot of inconvenience in dealing with multiple edges, because, for example, in the case I present in the notebook:

• The system represented by the graph happens to be highly complex and highly important despite its apparent simplicity. Everything in it carry a lot of meaning.

• Plotting the different packages (categories) of edges separately in different graphs hides much key information about the whole system. There are not three graphs (three systems) there is just one, and all the elements with their own colours must be plotted and make visible.

• The whole view of the system, plotted in one graph, explains at first sight how it works. Right applied colours are a must.

• It is not just the lines (graphical edges) which matter, both the vertex and the edges properties and other attached stuff to them are critical to the graph (system) representation. If the elements are hidden all the information attached to them is hidden too, and lost.

In the attached notebook the much of the whole issue will be found, and any suggestion would be very appreciate.

Thanks.

Martin.


P.S.

I beg your pardon for posting the following text here, but I did not find the appropriate place to post it.

Attachments:
POSTED BY: E Martin
5 Replies
Posted 9 years ago

Jaebum,

Using your code above, I tried the following to add labels, hyperlinks and tooltips to the edges,

coloredges = SetColorFunction[edgesets];
MVPQGraph = 
 Graph[{"M", "V", "P", "Q"}, edgesets[[All, 1]], VertexSize -> .09, 
  VertexLabels -> 
   Placed["Name", Center],(*EdgeLabels\[Rule]edgelabels,*)
  VertexShapeFunction -> "RoundedSquare", 
  VertexStyle -> Hue[0.125, 0.7, 0.9], 
  VertexLabelStyle -> Directive[Bold, FontFamily -> "Arial", 12], 
  EdgeStyle -> Arrowheads[{{.03, .3}}], 
  EdgeShapeFunction -> ReleaseHold[coloredges],
  EdgeLabels ->
   Table[edgesets[[i]][[1]] -> 
     Placed[
      Tooltip[
       Hyperlink[
        Graphics[{Text[Style[i, 9, Bold], {0, 0}], Circle[], 
          Lighter[edgesets[[i]][[2]], .3], Opacity[.7], Disk[]} , 
         ImageSize -> 20], "http://community.wolfram.com"]], Center], 
    {i, 17}] ]

And obtained this

enter image description here

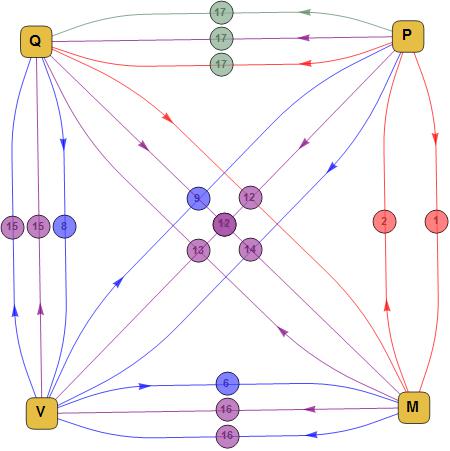
Which resembles the initial problem. with the colours.

It seems that the EdgeLabels directives must be managed by your functions

colorFuncSet[edge_, clist_] := 
 With[{a = Unique["x"]}, {Inactive[a], 
   Inactive[edge -> (a = 0; {a++; clist[[a]], Arrow[#]} &)]}]

SetColorFunction[edgeset_] := 
 Block[{gather}, 
  gather = colorFuncSet[#[[1, 1]], #[[All, 2]]] & /@ 
    GatherBy[edgesets, First];
  (With[{var = gather[[All, 1]], cont = gather[[All, 2]]}, 
     Hold@Module[var, cont]] /. Inactive[x_] :> x)]

The indices and colours repeated in the circles are saying that the edge labels allocation must be done in similar form as the issue with the overlapping edges themselves.

I have tried many other things as

elabels = Flatten[{ #[[1]][[1]] -> Table[Placed[
         Tooltip[
          Hyperlink[
           Graphics[{Text[Style[j, 9, Bold], {0, 0}], Circle[], 
             Lighter[#[[j]][[2]], .3], Opacity[.7], Disk[]} , 
            ImageSize -> 20], "http://community.wolfram.com"]], 
         Center], {j, 1, Length[#]}] & /@ gathering}, 1];

elabels // Column

And applied directly 'elabels' as EdgeLabels -> elabels in

 MVPQGraph = 
    Graph[{"M", "V", "P", "Q"}, edgesets[[All, 1]], VertexSize -> .09, 
     VertexLabels -> 
      Placed["Name", Center],(*EdgeLabels\[Rule]edgelabels,*)
     VertexShapeFunction -> "RoundedSquare", 
     VertexStyle -> Hue[0.125, 0.7, 0.9], 
     VertexLabelStyle -> Directive[Bold, FontFamily -> "Arial", 12], 
     EdgeStyle -> Arrowheads[{{.03, .3}}], 
     EdgeShapeFunction -> ReleaseHold[coloredges],
     EdgeLabels ->
      elabels ]   

But does not work either. It is even worse.

So, I give up for the moment.

It is a pity, since this should not be a big issue if the multiple edges were treated consistently by Mathematica.

Many thanks again.

POSTED BY: E Martin

I had the same problem while working on the solutions visualization in the discussion LinearProgramming approach for "best teams" algorithm -- I had to resort to using GraphPlot.

POSTED BY: Anton Antonov
Posted 9 years ago

Jaebum,

Your solution is pretty smart (and rather tricky too); it works after adding new edges with new colours.

Now I am traying to attatch hyperlinks to the edges but before I need a complete understanding of the structure of your construct.

I will be back with the full solution, adding tooltips and/or hyperlinks, if am able to make it.

Martin.

POSTED BY: E Martin
Posted 9 years ago

Hi Jaebum,

It seems to work OK.

I am going to give it a deeper try.

Many thanks.

Martin.

POSTED BY: E Martin
Posted 9 years ago

Here's one can be considered:

colorFuncSet[edge_, clist_] := 
 With[{a = Unique["x"]}, {Inactive[a], 
   Inactive[edge -> (a = 0; {a++; clist[[a]], Arrow[#]} &)]}]

SetColorFunction[edgeset_] :=
 Block[{gather},
  gather = 
   colorFuncSet[#[[1, 1]], #[[All, 2]]] & /@ GatherBy[edgesets, First];
  (With[{var = gather[[All, 1]], cont = gather[[All, 2]]}, 
     Hold@Module[var, cont]] /. Inactive[x_] :> x)
  ]

Example:

edgesets = {"P" \[DirectedEdge] "M" -> RGBColor[1, 0, 0], 
   "M" \[DirectedEdge] "P" -> RGBColor[1, 0, 0], 
   "P" \[DirectedEdge] "Q" -> RGBColor[1, 0, 0], 
   "Q" \[DirectedEdge] "M" -> RGBColor[1, 0, 0], 
   "M" \[DirectedEdge] "V" -> RGBColor[0, 0, 1], 
   "V" \[DirectedEdge] "M" -> RGBColor[0, 0, 1], 
   "P" \[DirectedEdge] "V" -> RGBColor[0, 0, 1], 
   "Q" \[DirectedEdge] "V" -> RGBColor[0, 0, 1], 
   "V" \[DirectedEdge] "P" -> RGBColor[0, 0, 1], 
   "V" \[DirectedEdge] "Q" -> RGBColor[0, 0, 1], 
   "P" \[DirectedEdge] "Q" -> RGBColor[0.5, 0, 0.5], 
   "Q" \[DirectedEdge] "M" -> RGBColor[0.5, 0, 0.5], 
   "M" \[DirectedEdge] "Q" -> RGBColor[0.5, 0, 0.5], 
   "P" \[DirectedEdge] "V" -> RGBColor[0.5, 0, 0.5], 
   "V" \[DirectedEdge] "Q" -> RGBColor[0.5, 0, 0.5], 
   "M" \[DirectedEdge] "V" -> RGBColor[0.5, 0, 0.5]};

coloredges = SetColorFunction[edgesets];
MVPQGraph = 
  Graph[{"M", "V", "P", "Q"}, edgesets[[All, 1]], 
   VertexSize -> .09*(5/3),  
   VertexLabels -> 
    Placed["Name", Center],  (*EdgeLabels\[Rule]edgelabels ,*)
   VertexShapeFunction -> "RoundedSquare", 
   VertexStyle -> Hue[0.125, 0.7, 0.9], 
   VertexLabelStyle -> Directive[Bold, FontFamily -> "Arial", 12], 
   EdgeStyle -> Arrowheads[{{.03 , .3}}], 
   EdgeShapeFunction -> ReleaseHold[coloredges]]

enter image description here

POSTED BY: Jaebum Jung
Reply to this discussion
Community posts can be styled and formatted using the Markdown syntax.
Reply Preview
Attachments
Remove
or Discard

Group Abstract Group Abstract