This has been a request by me already many many times; being able to scale whatever Axis in whatever type of plot....
It is possible, but you have to do some trickery to do this.... We cheat the system by replacing the tickmarks. (Which is what LogPlot and related functions do). Here is an example:
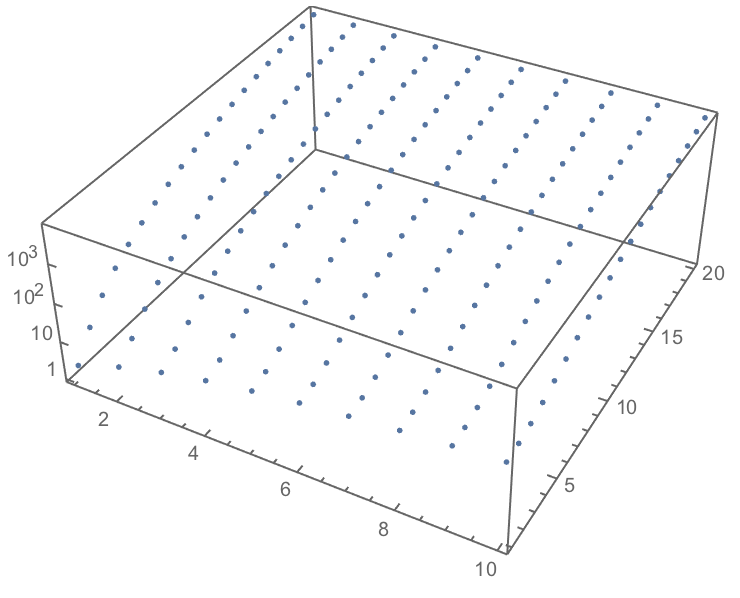
data=Catenate[Table[{x,y,x^2+y^3},{x,1,10},{y,1,20}]];
data[[All,3]]=Log10[data[[All,3]]];
verticalticks={#,"10"^#}&/@Range[Floor[Min[data[[All,3]]]],Ceiling[Max[data[[All,3]]]],1];
ListPointPlot3D[data,Ticks->{Automatic,Automatic,verticalticks}]