Now Mathematica 10.4 was released, I was excited and cannot wait going through all the new functions. Usually I do it from the "Summary of New Features in 10.4", which is quite a great collection of entrances to the new features' separate documentations with detailed category according to their functionalities. However, given the obvious naming convention of the built-in functions, I was always wondering another kind of "category": what it is alike to group them by the similarity of their names. Now of course it looks doable by iteratively applying the FindClusters with a DistanceFunction like EditDistance, but to really implement it will turn out to be a bit clumpy - especially comparing to what I used in the following text :)
Look at the Summary page, under the Mathematical Computation & Algorithms > Cluster Analysis, there is a new introduced function called ClusteringTree, whose function can be roughly considered as the "hierarchical version" of FindClusters, with some Graph-related wrapper. That is our star today.
Now our goal is to
hierarchically group the function names according to their literal similarity,
and to style the result to a more visually informative way.
With the help of ClusteringTree, the 1st goal can be accomplished fully automatically, while the 2nd one is also partly done.
Details, details ...
OK. For a step-by-step walk-through, we first extract all the newly introduced functions/symbols by scanning all the documentation notebooks with word "NEW IN xxx":

referencePath = "C:\\Program Files\\Wolfram Research\\Mathematica\\10.4\\Documentation\\English\\System\\ReferencePages\\";
filelst = FileNames["*.nb", {referencePath}, ?];

taglst = Function[filename,
                        Module[{file, str},
                            file = OpenRead[filename];
                            str = ReadList[file, "String", 1000] // StringJoin;
                            Close[file];
                            StringCases[
                                str, ___ ~~ "\"\\<\\\"NEW IN " ~~ v : Shortest[___] ~~
                                        "\\\"\\>\"" ~~ ___ :> v]
                            ]
                        ] /@ filelst; // AbsoluteTiming // First

(* Out: 22.2431 *)
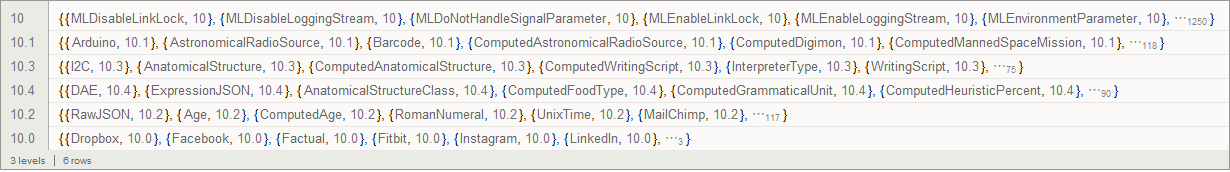
Then we group them by the version number of their first debut:
newGroup = Select[
                {
                        StringDrop[FileNameSplit[#][[-1]], -3] & /@ filelst,
                        taglst /. {} -> 0 /. {s_String} :> s
                        }\[Transpose],
                #[[2]] =!= 0 &
                ] // GroupBy[Last];
newGroup // Dataset
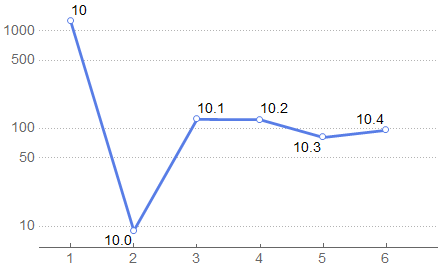
From the statistics we can see the trend of new feature introduction since version 10:
Length /@ newGroup //
    RightComposition[
        KeySort,
        Normal,
        Labeled[#2, #1] & @@@ # &,
        ListLinePlot[#,
                PlotTheme -> {"Business", "SizeScale"},
                PlotRange -> {{.5, 6.5}, All},
                ScalingFunctions -> "Log"
                ] &
        ]
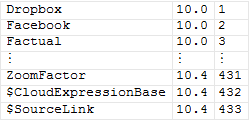
As the new functions introduced in the version 10 is too large, we'll omit them herefrom (but please do check the 2MB PNG attachment at the end of the post!):
newFuncHistory =
        newGroup[[{"10.0", "10.1", "10.3", "10.4", "10.2"}]] //
            RightComposition[
                Values,
                Flatten[#, 1] &,
                SortBy[Last],
                MapIndexed[Join[##] &, #] &
                ];
Join[
        newFuncHistory[[1 ;; 3]],
        {Table["\[VerticalEllipsis]", 3]},
        newFuncHistory[[-3 ;;]]
        ] // Grid
At this stage we are all good for trying ClusteringTree:
ClusteringTree[newFuncHistory[[;; 50, 1]], ClusterDissimilarityFunction -> "Ward"]
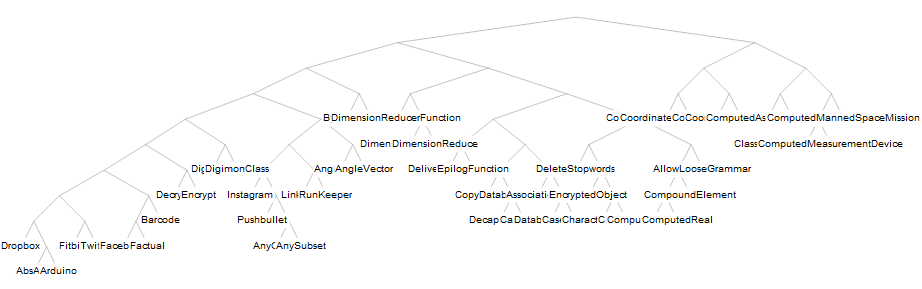
Now the default appearance from ClusteringTree looks possibly not that good for larger tree like the full data of newFuncHistory, we are going to post-process it a bit.
First we would like to rotate the tree to grow from left to right:
rotateRule = {x_Real, y_Real} :> {-6. y, x};
Then we might wish to use a more curved edge style than straight-line:
bzcRule = {a : {x1_Real, y1_Real}, b : {x2_Real, y2_Real}} :>
            BezierCurve[{a, {Mean[{x1, x2}], y1}, {Mean[{x1, x2}], y2}, b}, SplineDegree -> 3];
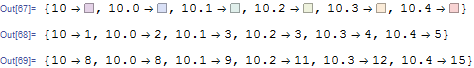
Last, as the function names are going to be labels in our final graphics, we would like to style them according to their introduced versions. More specifically, we would like to place the newest ones on the toppest layers, render them with the biggest font-size and highlight with distinguishable colors:
keys = Keys[newGroup] // Sort;
colorRule =
    MapIndexed[#1 -> Lighter[ColorData["Rainbow"][Rescale[#2[[1]], {1, Length@keys}]], .8] &, keys]
shadowRule =
    MapIndexed[#1 -> Round[Rescale[#2[[1]], {1, Length@keys}, {1, 5}]] &, keys]
sizeRule =
    MapIndexed[#1 -> Round[Rescale[Rescale[#2[[1]], {1, Length@keys}]^2, {0, 1}, {8, 15}]] &, keys]
All of those styling rules go into this label rendering function:
fbFunc = Function[{str, ver},
            Framed[
                    Style[str, FontSize -> (ver /. sizeRule)],
                    FrameMargins -> None,
                    FrameStyle -> None,
                    Background -> (ver /. colorRule),
                    RoundingRadius -> 3
                    ] //
                If[ver === "10", #,
                        (* for the shadow effect: *)
                        Framed[
                            #,
                            FrameMargins -> ({{-1, 1.2 ver}, {ver, -1}} /. shadowRule),
                            FrameStyle -> None,
                            Background -> GrayLevel[0.1, 0.21],
                            RoundingRadius -> 5
                            ]
                        ] &
            ];
Note here we used nested Frameds, with the outer one for simulating a drop-shadow effect. If you find the covering picture a little bit of 3D feeling, he's the magic. :)
Now we have the rendering function, we can construct a substitution rule fitting the data structure of the result returned by ClusteringTree:
styleRule =
        StringJoin["\"", #1, "\""] -> {fbFunc[#1, #2], #3} & @@@ newFuncHistory;
labelFunc = Function[{str, pos},
              {Inset[#1, pos, {-1, 0}, BaseStyle -> "Graphics"], #2} & @@ (str /. styleRule)
            ];
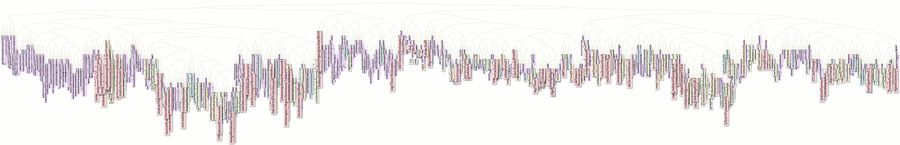
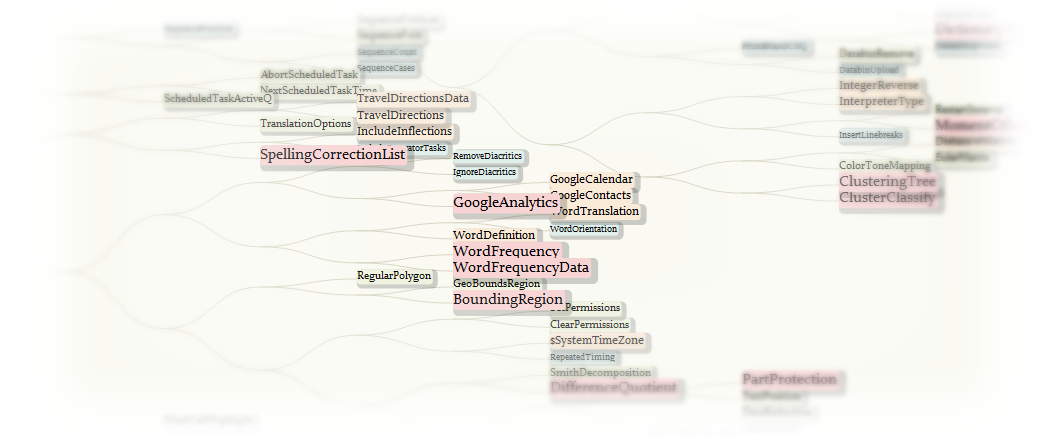
Finally, we compose all the steps together, a "fancy" version of ClusteringTree is here (better right-click and open in a new tab for full size of view):
newFuncHistory[[;; , 1]] //
    RightComposition[
        (* here we only randomly take 100 samples as a test: *)
        RandomSample[#, 100] &,
        ClusteringTree[#, ClusterDissimilarityFunction -> "Ward"] &,
        ToBoxes,
        #[[1, 2, 2, 1]] &,
        Cases[#, (LineBox | InsetBox)[__], ?] &,
        # /. {
                    LineBox[pts_] :> 1[pts /. rotateRule],
                    InsetBox[BoxData[""], __] :> Sequence[],
                    InsetBox[FormBox[FrameBox[str_, __], TraditionalForm], pos_,
                            BaseStyle -> "Graphics"] :> 2[{str, pos /. rotateRule}]
                    } &,
        Flatten,
        GroupBy[Head -> First],
        KeySort,
        Values,
        MapAt[Join[{Hue[0.15, 0.09, 0.84], Thick},
                        Flatten[# /. bzcRule]] &, #, 1] &,
        MapAt[labelFunc @@@ # &, #, 2] &,
        MapAt[SortBy[Last], #, 2] &,
        MapAt[#[[;; , 1]] &, #, 2] &,
        Flatten,
        Graphics[#, Background -> Hue[0.15, 0.03, 0.98]] &
        ]
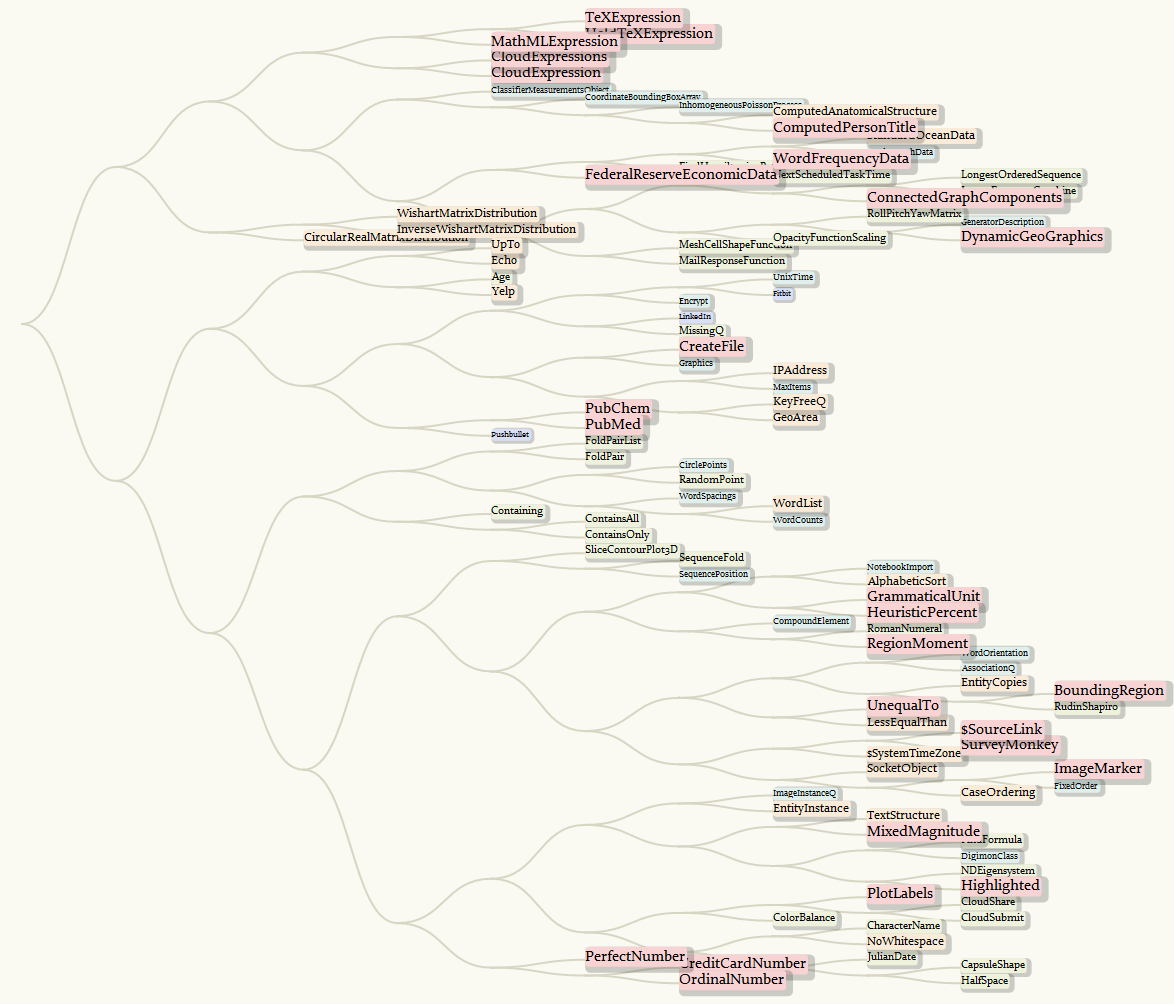
By taking all the function names from 10.0 to 10.4, we can have a more comprehensive infograph:
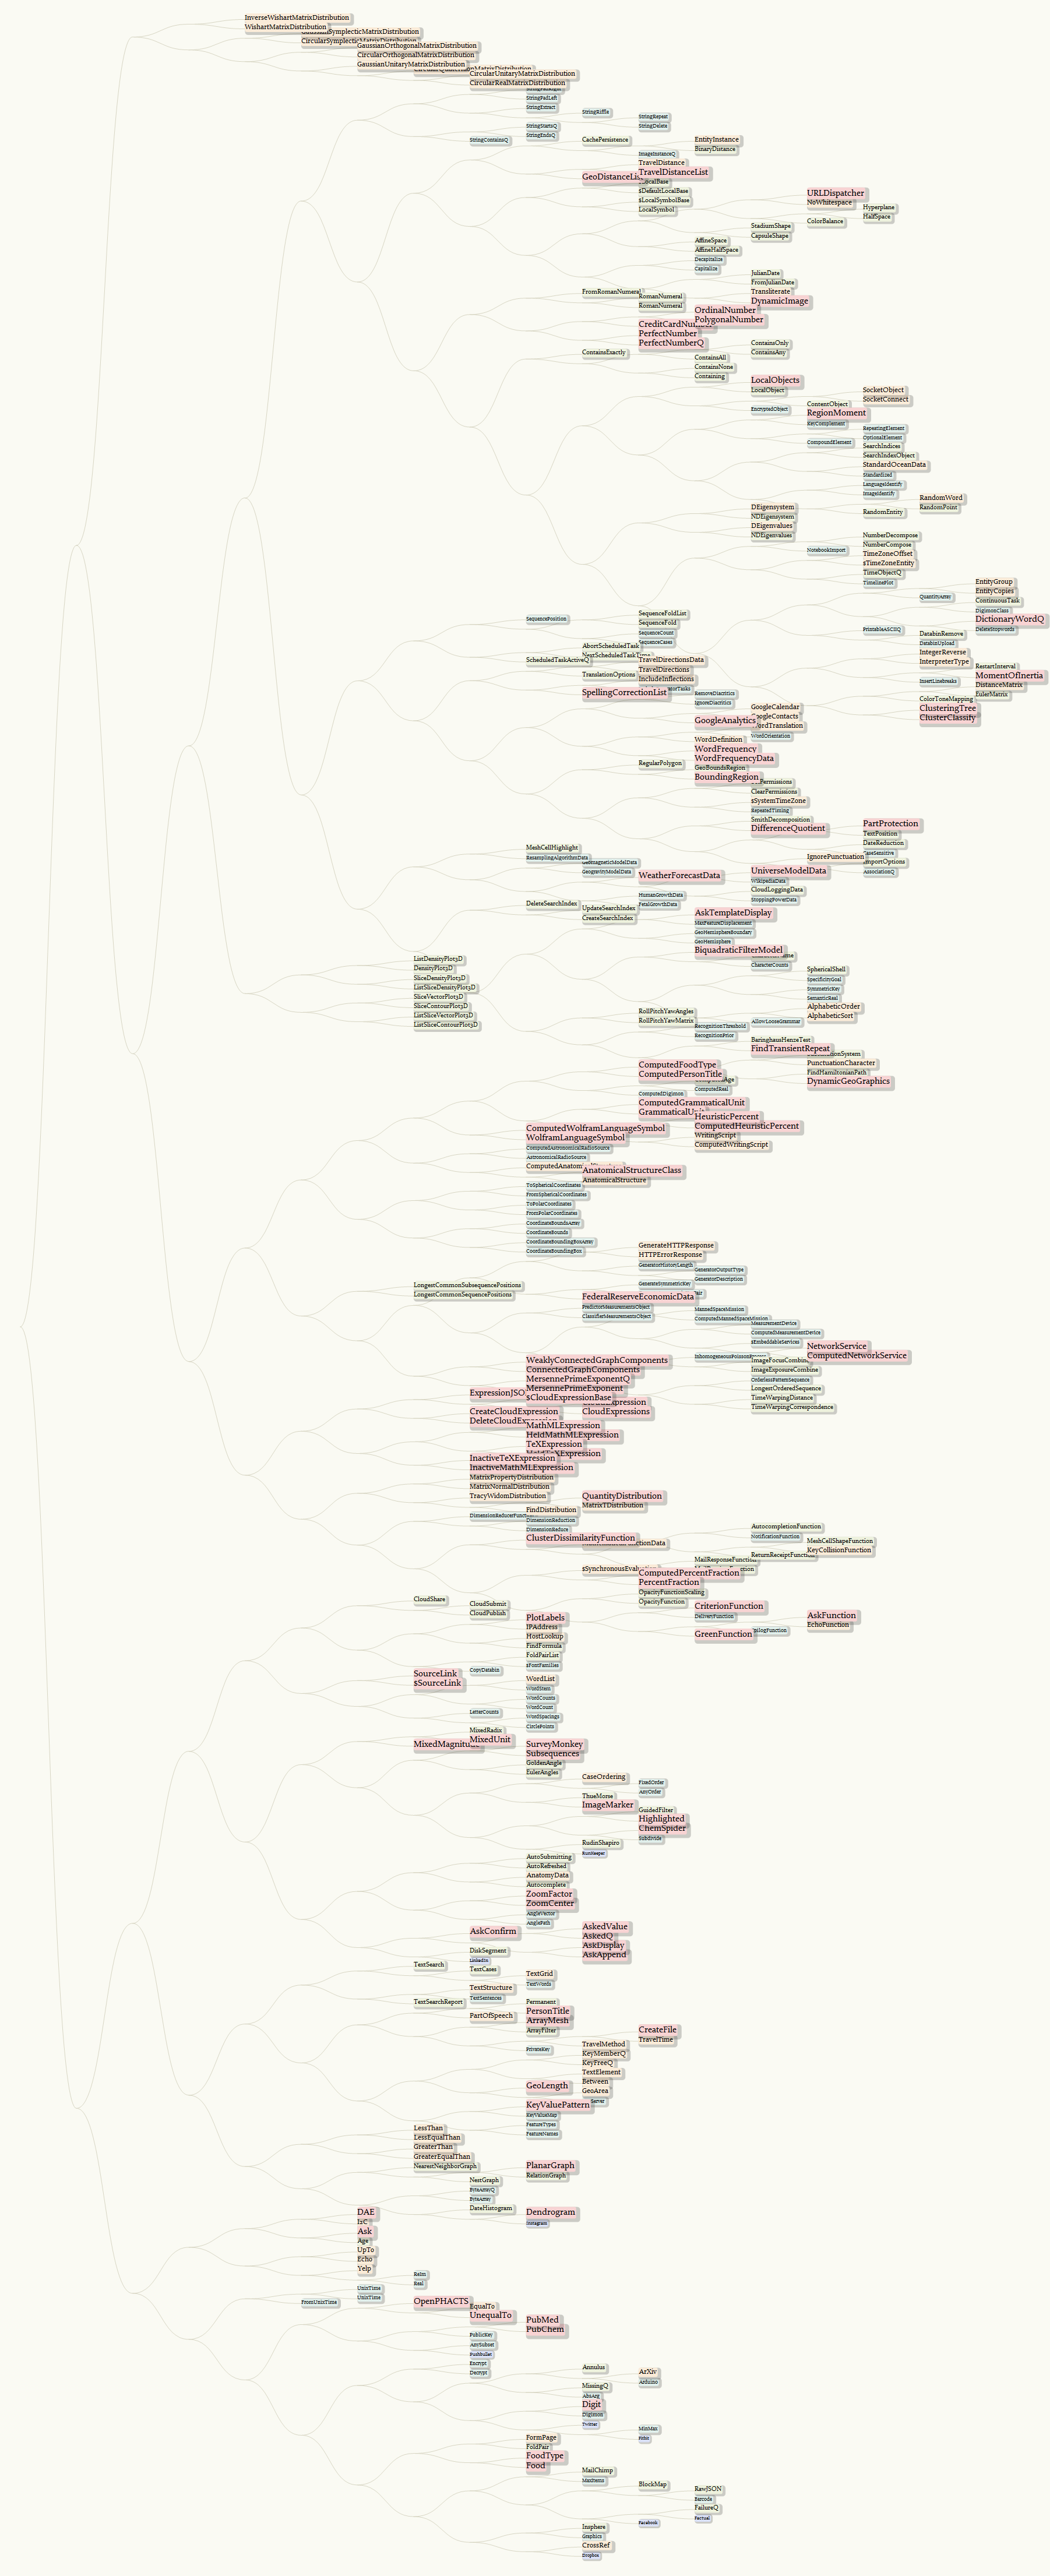
And for those kind readers having reached the end of this post, an infograph counting from the initial version of 10.x (it's a thumbnail with a hyperlink to a 1.93MB PNG with size of 1939 x 14621, so you may want to right-click and open link in new tab! :)