Message Boards Message Boards

Varying color parametrically along a curve?

Posted 8 years ago

I'm trying to vary the color of a ParametricPlot along the curve according to a function of t, for experimental purposes and to make cool designs. I've tried:

ParametricPlot[{Cos[4 t] - Cos[0.5 t] + Sin[t], Sin[3 t] - Sin[2 t]}, {t, 0, 4 Pi}, PlotStyle -> Thickness[0.01], 
 ColorFunction -> Function[{t}, ColorData["DarkRainbow"][2.49 Sin[t] - Sin[0.33 t]]]]

enter image description here

and

ParametricPlot[{Cos[4 t] - Cos[0.5 t] + Sin[t], Sin[3 t] - Sin[2 t]}, {t, 0, 4 Pi}, PlotStyle -> Thickness[0.01], ColorFunction -> Function[{t}, Hue[0.1 Sin[0.3 t] - Sin[2 t]]]]

enter image description here

These attempts fail because the color is constant for x (I want the color to vary with an arbitrary function of t, which should make the color different at different x values), and because the color only goes through the spectrum once. Ideally, the solution would utilize one of the ColorData schemes (i.e. "Pastels") such that the curve would oscillate in that color scheme multiple times along the curve according to a function f[t].

Thanks in advance, sorry if it's a newbie question.

POSTED BY: Bryan Lettner
5 Replies

The problem is that ColorData["Pastel"] wants the argument between 0 and 1. You can rescale your curvature, though:

x = Sin[t] + 2/3 Sin[3 t];
y = Cos[t] + 2/3 Cos[3 t];
curvature[t_] =
  (D[x, t] D[y, {t, 2}] - 
     D[y, t] D[x, {t, 2}])/(D[x, t]^2 + D[y, t]^2)^(3/2);
ParametricPlot[{Sin[t] + 2/3 Sin[3 t], Cos[t] + 2/3 Cos[3 t]}, {t, 0, 
  2 Pi}, ColorFunction -> 
  Function[{x, y, u}, 
   ColorData["Pastel"][
    Rescale[curvature[u], {curvature[Pi/2], curvature[0]}, {0, 1}]]], 
 ColorFunctionScaling -> False]
POSTED BY: Gianluca Gorni
Posted 8 years ago

works great thank you!

enter image description here

POSTED BY: Bryan Lettner
Posted 8 years ago

Okay, so I've realized that what I'm trying to do is vary the Hue or shade of the curve by it's curvature.

ParametricPlot[{Sin[t] + 2/3 Sin[3 t], Cos[t] + 2/3 Cos[3 t]}, {t, 0, 2 Pi}]

enter image description here

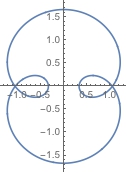
So the loops with more curvature would appear a different color than the flatter parts of the curve. No luck so far. I've tried:

x = Sin[t] + 2/3 Sin[3 t];
y = Cos[t] + 2/3 Cos[3 t];

enter image description here

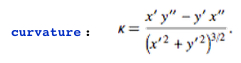
curvature = (D[x, t] D[y, {t, 2}] -D[y, t] D[x, {t, 2}])/(D[x, t]^2 + D[y, t]^2)^(3/2)


ParametricPlot[{Sin[t] + 2/3 Sin[3 t], Cos[t] + 2/3 Cos[3 t]}, {t, 0, 2 Pi}, 
ColorFunction -> Function[{x, y, t}, ColorData["Pastel"][curvature]]]

enter image description here

(Doesn't work). I've also tried

ColorFunction -> Function[{x, y, t}, Hue[curvature]]

to no avail. And I looked into ArcCurvature and FrenetSerretSystem but couldn't come up with a solution. Any ideas?

POSTED BY: Bryan Lettner
Posted 8 years ago

Good Information.

POSTED BY: Razib Paul

You need to use the 3rd argument in this case (go to the help of ColorFunction there it will be shown which parameters and in what order are passed on to ColorFunction. ParametricPlot in this case gets x,y,t values...

ParametricPlot[{Cos[4 t] - Cos[0.5 t] + Sin[t], Sin[3 t] - Sin[2 t]}, {t, 0, 4 Pi}, PlotStyle -> Thickness[0.01], ColorFunction -> Function[{x, y, t}, Hue[0.1 Sin[0.3 t] - Sin[2 t]]]]
POSTED BY: Sander Huisman
Reply to this discussion
Community posts can be styled and formatted using the Markdown syntax.
Reply Preview
Attachments
Remove
or Discard

Group Abstract Group Abstract