Message Boards Message Boards

1
|
6159 Views
|
5 Replies
|
1 Total Likes
View groups...
Share
Share this post:

Trying to reverse engineer an equation

Posted 8 years ago

Hi. I work for a combustion research facility studying various fields from fuel efficiency to alternative fuels to pollution control. We are using software which was written in 1994 (DOS based) to produce a series of 11 points based on a range and a "K-Factor". These points are then used in the calibration of some of the equipment that are in the labs. Due to recent equipment changes, we need to update the software but we do not have access to the original code or the author (he retired a long time ago). As a result, we do not know what algorithms were used to create the data sets. I'm wondering if there is a way to figure out the equation(s) used in the software based on the data sets produced.

The only inputs that the software requires are a Range Max. Value (the software always assumes that the minimum value is 0) and a K-Factor. A K-Factor of 1 produces a straight line when plotted while K-Factor other than 1 produces a curve with 0 and the Max Range as fixed points.

I used the software to create the following sample data sets using a Max. Range Value of 25:

K Factor = 1.00, K Factor = 1.44, K Factor = 0.813

100%    25.0000    25.0000    25.0000
90%    22.5000    22.7252    22.3902
80%    20.0000    20.4404    19.8057
70%    17.5000    18.0362    17.2463
60%    15.0000    15.6191    14.7114
50%    12.5000    13.1517    12.2008
40%    10.0000    10.6322    9.7142
30%    7.5000    8.0591    7.2511
20%    5.0000    5.4305    4.8112
10%    2.5000    2.7448    2.3943
0%    0.0000    0.0000    0.000

I'm hoping that someone out there can help me out as I've hit the end of my admittedly limited math skills.

Thanks in advance for any information that you can provide.

Dave

POSTED BY: David Faguy
5 Replies

I think if we know more about the physics behind the data it would be easier to find the model

POSTED BY: Kay Herbert
Posted 8 years ago

Thanks for the responses.

@ Bill Simpson: Unfortunately, the K Factors are hard coded into the software which is the reason we need to figure the equation out. The K Factor for our new equipment does not correspond to any of the hard coded values. The available K Factors are 1.44, 1.23, 1.0, 0.894, 0.879, and 0.813. I've attached a sample spreadsheet with three tables to this post.

Also, I ran this problem by some people here with much higher level math Kung-Fu than I have and they came up with the following equation:

Y = MP(1-M(F-1)(P-1)) Where: M = Max Range Value, P = Percent of Max Range Value, F = K Factor

This equation works well in some cases but is off in others so it needs to be refined if we're going to use it.

Attachments:
POSTED BY: David Faguy
Posted 8 years ago

Thanks for the data.

It looks like you have one bad data point in the first set. In the "0.4" row and "0.879" column you have 9.345 which appears to be out of line. Perhaps that should have been 5.9345.

Looking at the data available, as Vitaliy Kaurov noted, it appears that the largest component is a linear factor. Getting enough information to estimate the equation for that line seems like the first step.

Removing that linear factor then seems to show that a quadratic factor remains. Getting enough information to estimate the peak of that parabola seems like the next step. With the three data sets I can try to estimate that peak.

Having all six data sets would help determine whether the linear scale factor is proportional to the K factor or whether the relationship is more complicated. Likewise for the peak of the parabola.

With that information the max range value then it would be possible to see whether the result is exactly the same as the equation that you have already been given or whether there are differences.

If the pattern in the data persists then perhaps the values for x=.5 and x=1. for each of the other combinations of variables may be enough.

POSTED BY: Bill Simpson

This is not a solution. But perhaps this could set someone on the right track of thought:

str = "100%    25.0000    25.0000    25.0000
  90%    22.5000    22.7252    22.3902
  80%    20.0000    20.4404    19.8057
  70%    17.5000    18.0362    17.2463
  60%    15.0000    15.6191    14.7114
  50%    12.5000    13.1517    12.2008
  40%    10.0000    10.6322    9.7142
  30%    7.5000    8.0591    7.2511
  20%    5.0000    5.4305    4.8112
  10%    2.5000    2.7448    2.3943
  0%    0.0000    0.0000    0.000";

data = ImportString[str, "Data"] /. 
   x_String :> ToExpression[StringReplace[x, "%" -> ""]];
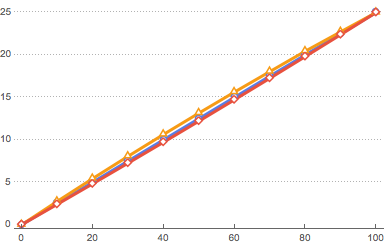
ListLinePlot[{
data[[All, {1, 2}]], data[[All, {1, 3}]], data[[All, {1, 4}]]
}, PlotTheme -> "Business"]

enter image description here

FindFormula[data[[All, {1, 2}]], x]
FindFormula[data[[All, {1, 3}]], x]
FindFormula[data[[All, {1, 4}]], x]

0.25 x

0.276011 x - 0.000261089 x^2

0.23832 x + 0.000111064 x^2 + 5.73427*10^-8 x^3

POSTED BY: Vitaliy Kaurov
Posted 8 years ago

Would you post a similar table with the K factor in steps of 0.1 across the range of available K?

POSTED BY: Bill Simpson
Reply to this discussion
Community posts can be styled and formatted using the Markdown syntax.
Reply Preview
Attachments
Remove
or Discard

Group Abstract Group Abstract