Hi. I work for a combustion research facility studying various fields from fuel efficiency to alternative fuels to pollution control. We are using software which was written in 1994 (DOS based) to produce a series of 11 points based on a range and a "K-Factor". These points are then used in the calibration of some of the equipment that are in the labs. Due to recent equipment changes, we need to update the software but we do not have access to the original code or the author (he retired a long time ago). As a result, we do not know what algorithms were used to create the data sets. I'm wondering if there is a way to figure out the equation(s) used in the software based on the data sets produced.
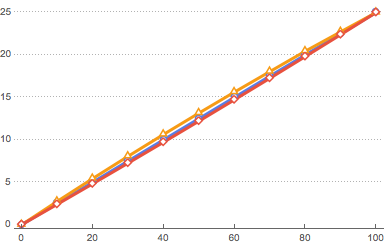
The only inputs that the software requires are a Range Max. Value (the software always assumes that the minimum value is 0) and a K-Factor. A K-Factor of 1 produces a straight line when plotted while K-Factor other than 1 produces a curve with 0 and the Max Range as fixed points.
I used the software to create the following sample data sets using a Max. Range Value of 25:
K Factor = 1.00, K Factor = 1.44, K Factor = 0.813
100% 25.0000 25.0000 25.0000
90% 22.5000 22.7252 22.3902
80% 20.0000 20.4404 19.8057
70% 17.5000 18.0362 17.2463
60% 15.0000 15.6191 14.7114
50% 12.5000 13.1517 12.2008
40% 10.0000 10.6322 9.7142
30% 7.5000 8.0591 7.2511
20% 5.0000 5.4305 4.8112
10% 2.5000 2.7448 2.3943
0% 0.0000 0.0000 0.000
I'm hoping that someone out there can help me out as I've hit the end of my admittedly limited math skills.
Thanks in advance for any information that you can provide.
Dave