Message Boards Message Boards

0
|
6854 Views
|
4 Replies
|
4 Total Likes
View groups...
Share
Share this post:

Create a ListVectorPlot from this data?

Posted 8 years ago

I cannot make ListVectorPlot work. I am using Mathematica 11 on Win 10. I created the following test code:

ListVectorPlot[{  { {1, 2}, {3, 4}}, {{5, 6}, {7, 8}} }]

data = Table[{{x, -3 x}, {2/7, x/5}}, {x, -2, 2, 1}]

ListVectorPlot[data]

The data are

{{{-2, 6}, {2/7, -(2/5)}}, {{-1, 3}, {2/7, -(1/5)}}, {{0, 0}, {2/7, 
   0}}, {{1, -3}, {2/7, 1/5}}, {{2, -6}, {2/7, 2/5}}}

The pictures that were generated are meaningless - they are copied below as pictures and attached as pdf. empty image numerous vectors

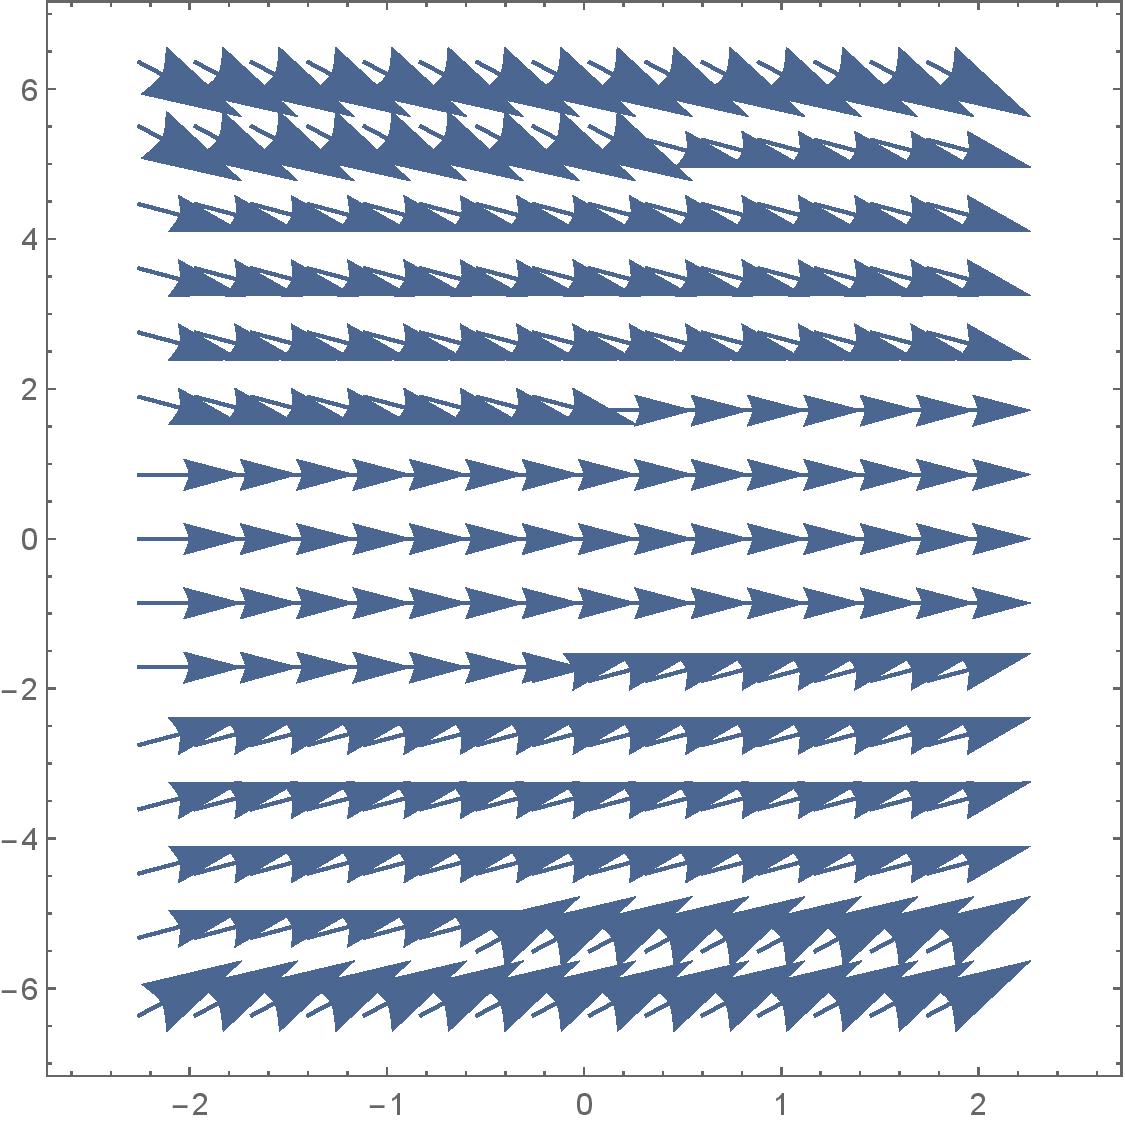
The first picture is empty. The second picture contains many more vectors than data. There were no error messages from Mathematica. Any and all help will be appreciated.

Chris

Attachments:
POSTED BY: Krzysztof Burdzy
4 Replies
Posted 8 years ago

A ListVectorPlot creates a vector field on a grid from the listed vectors through interpolation. Your first example has only two sets of vectors which is not enough to construct a vector field. (Should it give you an error or warning? Probably.)

For your second example, again, a vector field is created on a grid by interpolation of the vectors you give and can be denser than the grid of vectors that you give it.

POSTED BY: Jim Baldwin

It would seem that ListVectorPlot only works for vector arrays of at least 3 by 3. For smaller arrays I get the message VisualizationCoreListVectorPlot::vfldata

With[{n = 2}, 
 ListVectorPlot[Table[{1, 1}, {n}, {n}], VectorPoints -> All]]

I wonder why the message does not appear with your input

ListVectorPlot[{{{1, 2}, {3, 4}}, {{5, 6}, {7, 8}}}]

If you want as many vectors as data, just use the option VectorPoints->All:

With[{n = 3}, 
 ListVectorPlot[Table[{1, 1}, {n}, {n}], VectorPoints -> All]]
With[{n = 3}, ListVectorPlot[RandomReal[{0, 1}, {n, n, 2}]]]
POSTED BY: Gianluca Gorni

It works for

ListVectorPlot[Table[{1, 1}, {2}, {3}]]

and for

ListVectorPlot[Table[{1, 1}, {2}, {3}], VectorPoints -> All]
Posted 8 years ago

As Jim Baldwin points out, the first data set has insufficient rank to form a basis for interpolation. In version 10 this case did generate an error message, which no longer appears in 11. The reasonable solution would be to use the option VectorPoints->All, which tells ListVectorPlot to just plot the vectors as given -- no need for interpolation.

Unfortunately, even with that option, ListVectorPlot and ListVectorPlot3D still require a full rank set of vectors suitable for interpolation. I say unfortunately, because every time I have had occasion to use one of these functions I have wanted it to plot the vectors given -- I have never had a use for the interpolation, which I could construct myself if needed.

I reported this about 18 months ago, with the suggestion that VectorPoints->All eliminate the requirement for a full rank data set, but no joy so far.

POSTED BY: David Keith
Reply to this discussion
Community posts can be styled and formatted using the Markdown syntax.
Reply Preview
Attachments
Remove
or Discard

Group Abstract Group Abstract