Two hundred and six nations and the independent participants of the Refugee Olympic Athletes team have converged on Rio de Janeiro to compete in the Summer Olympics.
It's hard not to get excited by the ceremonies, the history-making and all the data the Olympics generates every two years. Plenty of late nights this week I've found myself, like many others around the world, with my eyes glued to the television and my fingers tightly crossed. Hundreds of questions are on everyone's mind as they watch the competitions, such as, how do smaller countries fare relative to the bigger nations? What is each nation historically good at? How much are those Olympic medals really worth? And with so much of this information already on Wolfram|Alpha, I decided to go ahead and see what I could find by combining Wolfram|Alpha and the Wolfram Language!
It Takes a Village
It's easy to ask Wolfram|Alpha for the medal count of any prior Olympics, such as the 2012 Summer Olympics in London. And with the WolframAlpha function, we can do it right from the comfort of a notebook.
WolframAlpha["2012 Olympic Medals"]
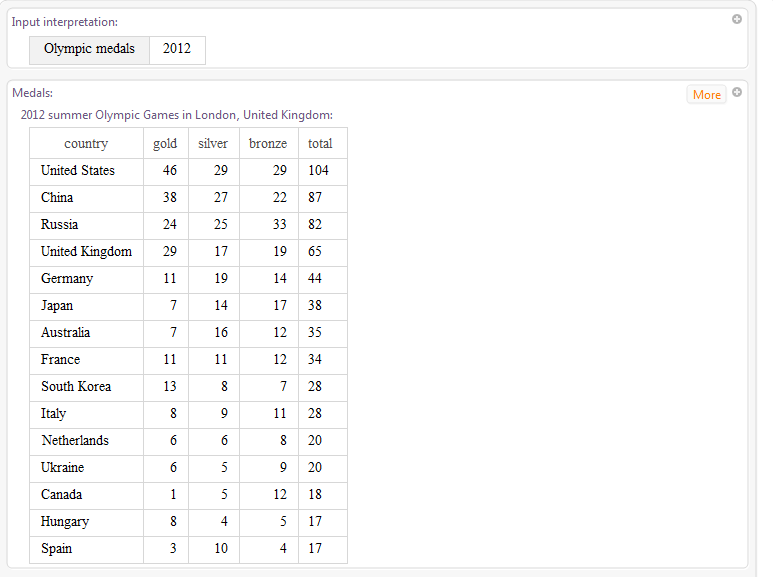
So the United States walked away with the most total medals. But ask any sports fan, from Little League tee-ball to world-class competitions, and you'll hear the same refrain: the entire community goes into the making of an athlete. With that adage in mind, I can't help but wonder: does the size of a nation's population correlate with the success of its Olympians? The United States, China and Russia are fairly populous nations, but how many medals did they win when divided by their population size?
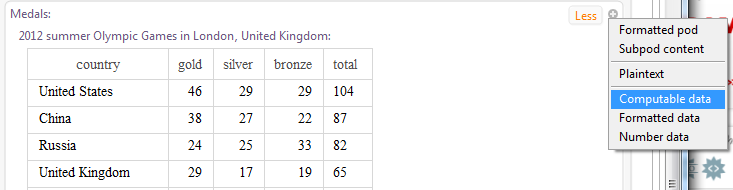
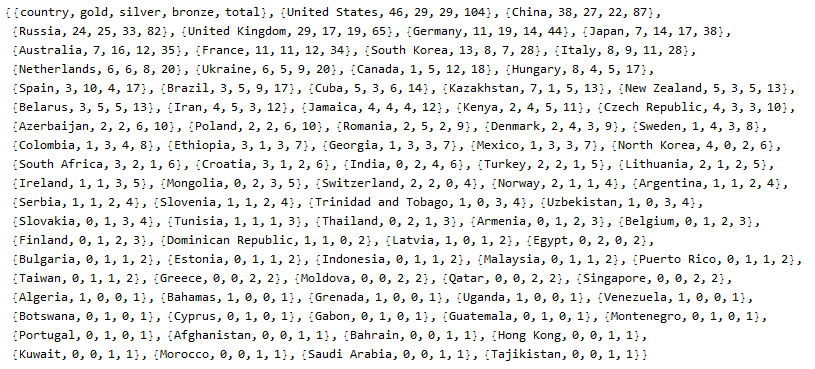
Luckily, I can easily grab the data in a nice computable form for the Wolfram Language to analyze, using one of the output options available when clicking the + button in the top-right corner of the pod. By selecting "Computable Data," the Wolfram Language will create the code I need and give me the results as a list.
WolframAlpha["2012 Olympic Medals", \
{{"OlympicMedalistResults:OlympicData", 1}, "ComputableData"},
 PodStates -> {"OlympicMedalistResults:OlympicData__More",
   "OlympicMedalistResults:OlympicData__More",
   "OlympicMedalistResults:OlympicData__More",
   "OlympicMedalistResults:OlympicData__More",
   "OlympicMedalistResults:OlympicData__More"}]
Then with the CountryData function, I can not only query for the population size of each country, but get the population specifically during 2012.
medals = Drop[%, 1];
populationIn2012[nation_] := CountryData[nation, {"Population", 2012}]
medalsPerPop = Table[{row[[1]], row[[-1]]/populationIn2012[row[[1]]]}, {row,
medals}];
sortedPerPop = Reverse[SortBy[medalsPerPop, Last]];
(* The five highest and the five lowest nations in terms of medals \
per person *)
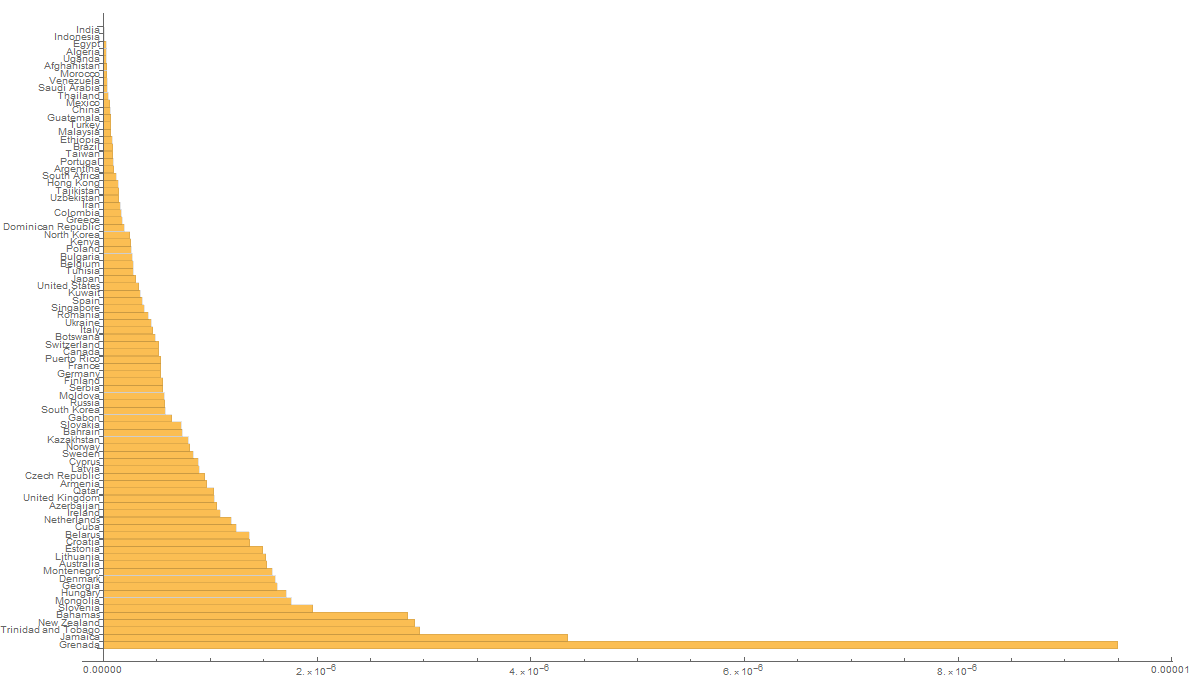
{sortedPerPop[[1 ;; 5]], sortedPerPop[[-5 ;; -1]]} // TableForm
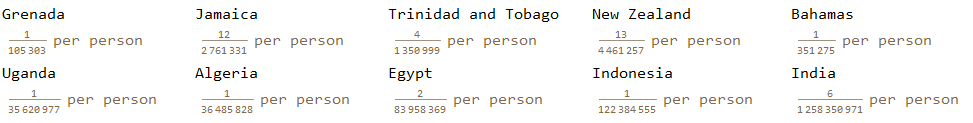
The island country of Grenada, in spite of winning just one gold medal in the men's 400 meters, completely dominated all other nations because of its low population size, with $9.49641*10^{-6}$ medals per citizen. India, on the other hand, earned six total medals, but its massive population means each citizen earned $4.76815*10^{-9}$ medals. In this ranking, the total count leaders---USA, China and Russia---are in 50th, 74th and 34th place, respectively.
Money, Money, Money
Let's consider this: what if, instead of a medal, Grenada was given the total market price of the metals that would have gone into the gold medal? Using the U.S. Geological Survey data on mineral and material commodities, this is a pretty easy question to estimate---the value of metals, including copper, can wildly fluctuate throughout the year, and the composition of Olympic medals varies for each Olympic host. For the composition of metals, I used a variety of different articles from the time (in particular this article) to come up with a reasonable estimate. Even though data on the composition of medals is in terms of grams, and USGS data is in terms of metric tons, the Wolfram Language can easily handle the unit conversions for me.
usgsData[filename_]:= UnitConvert[Quantity[Cases[Import[filename], {2012.,__},Infinity][[1,-3]],"USDollars"/"MetricTons"],"Grams"]
prices = AssociationMap[usgsData["ds140-" <>StringReplace[ #,"copper"->"coppe"]<>".xlsx"]&,{"gold","silver","copper","zinc","tin"}]

<|"gold"->$ 53.8`per gram,"silver"->$ 1.`per gram,"copper"->$ 0.0081`per gram,"zinc"->$ 0.00211`per gram,"tin"->$ 0.0283`per gram|>

costOfGoldMedal =381.1g * prices["silver"] + 5.5208g*prices["gold"] + 25.3792g*prices["copper"]
$ 678.32
costOfSilverMedal = 381.1g*prices["silver"] +30.9g*prices["copper"]
$ 381.35
costOfBronzeMedal = 346.29g*prices["copper"] + 8.925g*prices["zinc"]+1.785g*prices["tin"]
$ 2.87
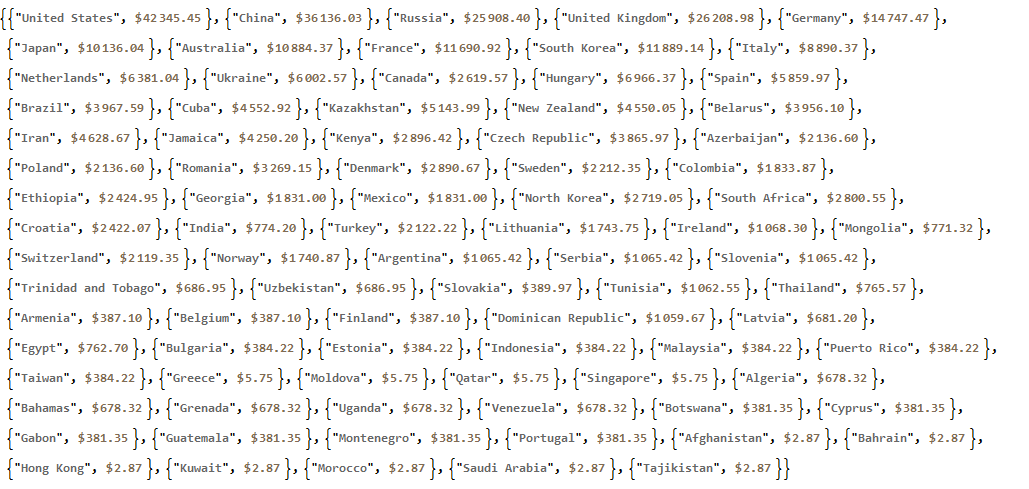
So Grenada would have taken home about 678.32 US dollars, and when divided by its 2012 population, there would be 0.00644165 USD, or just over half a penny per person. However, in terms of total gross, the rankings of nations by gross is largely the same as when they are ordered by total medal count, with the United States taking home 42,345.45 USD and China 36,138.83 USD, while bronze winners such as Morocco, Saudi Arabia and Tajikistan grossed as low as 2.87 USD.
medalGrosses = Table[{row[[1]], costOfGoldMedal*row[[2]] + costOfSilverMedal * row[[3]] + costOfBronzeMedal * row[[4]]}, {row, medals}]
Of course, Olympic medals are literally worth more than their weight in gold---there's a lot of sentimental value attached to them, and on the rare occasion an Olympic medal goes up for sale, it is for significantly more than the markup.
Doing What You're Good At
Also included in Wolfram|Alpha's knowledge about the Olympics is a breakdown of medals for each country by what sports the medals were won in.
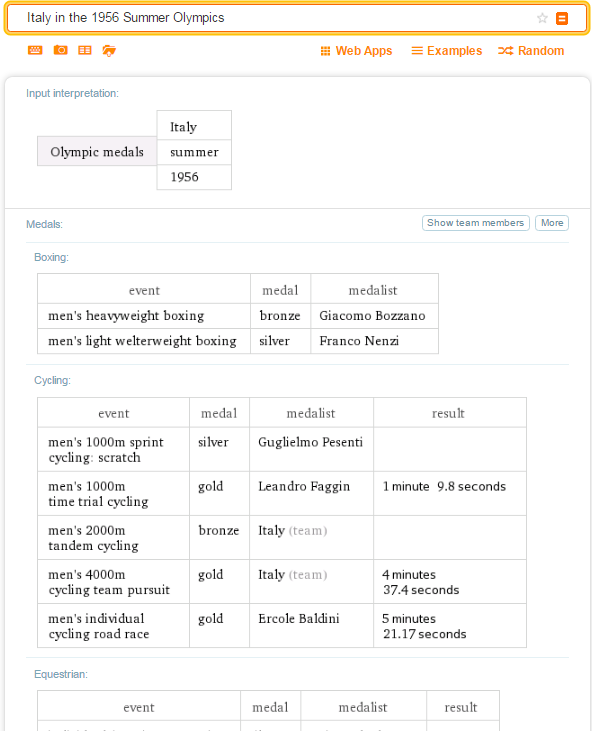
Why not apply this query and see which sports were the biggest contributors to medal counts in any given year?
medalsBySport[country_,year_, more_:99]:=
With[{waResults = WolframAlpha[country<>" at the "<>ToString[year]<> " summer olympics",
                              {{"OlympicMedalistResults:OlympicData",All},{"Title","ComputableData"}},
                              PodStates->{ToString[more]<>"@OlympicMedalistResults:OlympicData__More"},
                             TimeConstraint->Infinity]},
    {Last[#1], Length[Last[#2]]-1}&@@@GatherBy[waResults[[2;;]],#[[1,1]]&]]

chartifyMedalsBySport[results_]:=PieChart[Last/@results, ChartLabels->Placed[First/@results,"RadialCallout"],ChartStyle->54]

medalsBySport["Italy", 1956]~SortBy~Last
{{"Rowing",1},{"Sailing",1},{"Boxing",2},{"Shooting",2},{"Weightlifting",2},{"Wrestling",2},{"Equestrian",3},{"Cycling",5},{"Fencing",7}}
Italy's Distribution of Medals by Sport at the 1956 Olympics
chartifyMedalsBySport[%]
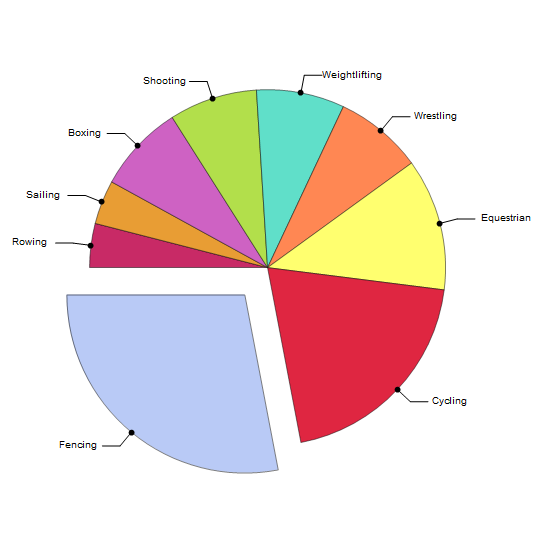
With the easy and flexible medalsBySport function, I can aggregate results across all Summer Olympics that Italy participated in. I was actually surprised to discover that Italy has quite the collection of medals in fencing, just by playing around with the Wolfram Language.
olympicyears = Range[1896, 2012, 4]~Complement~{1916, 1940, 1944};
allItalyMedals = medalsBySport["Italy", #] & /@ olympicyears;
aggregateMedals[allMedals_] := {First[First[#]], Total[Last /@ #]} & /@ GatherBy[Flatten[allMedals, 1], First]
aggregateMedals[allItalyMedals]~SortBy~Last
{{"Tennis",1},{"Basketball",2},{"Soccer",3},{"Taekwondo",3},{"Volleyball",5},{"Archery",7},{"Modern pentathlon",7},{"Water polo",8},{"Diving",9},{"Judo",13},{"Art contests",14},{"Sailing",14},{"Weightlifting",14},{"Canoeing",16},{"Swimming",18},{"Wrestling",20},{"Equestrian",23},{"Gymnastics",30},{"Shooting",35},{"Rowing",36},{"Boxing",47},{"Cycling",58},{"Track & field",60},{"Fencing",120}}
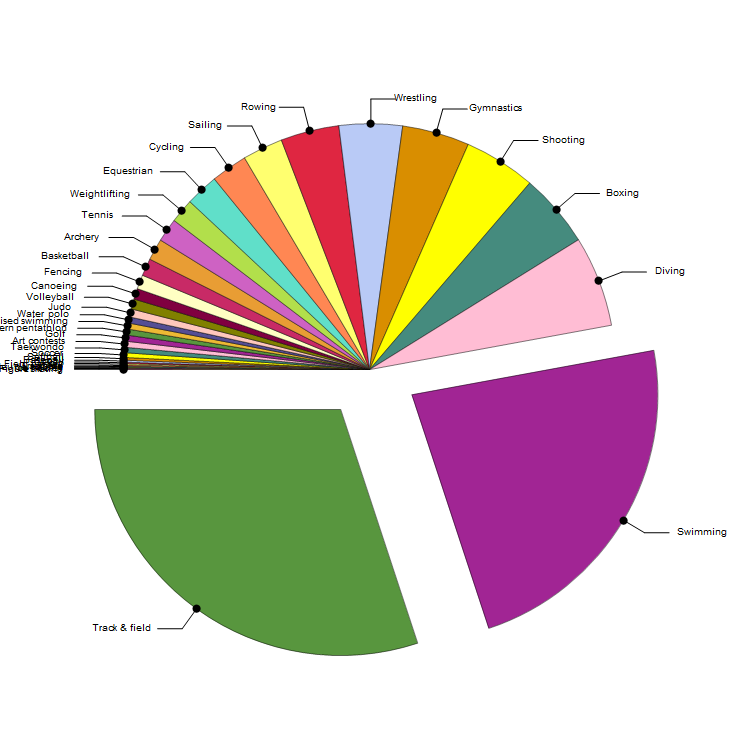
Italy's Distribution of Medals by Sport from 1896--2012
chartifyMedalsBySport[%]
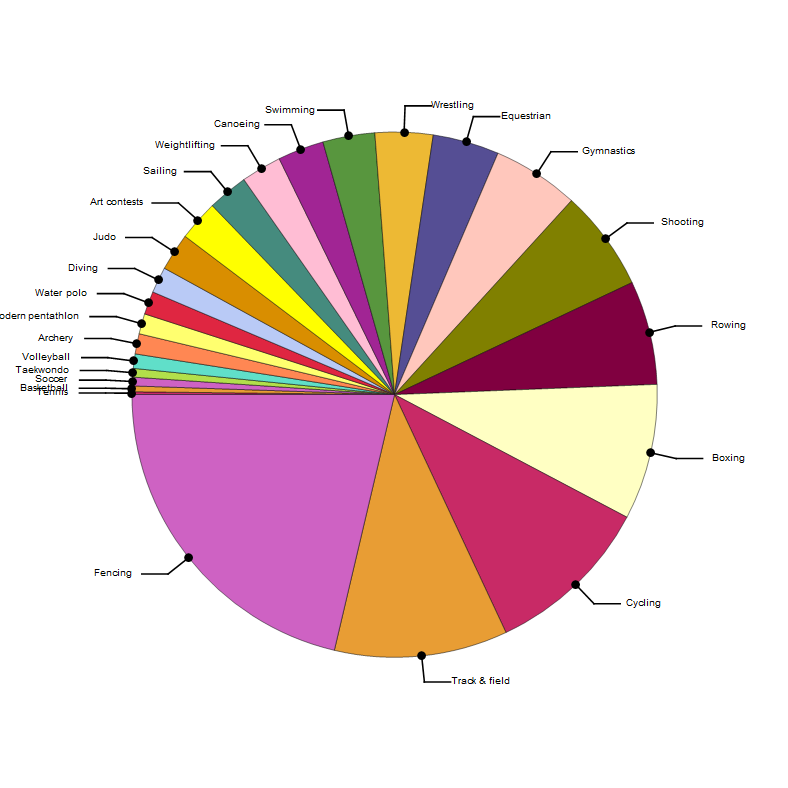
Meraviglioso! How about some other nations?
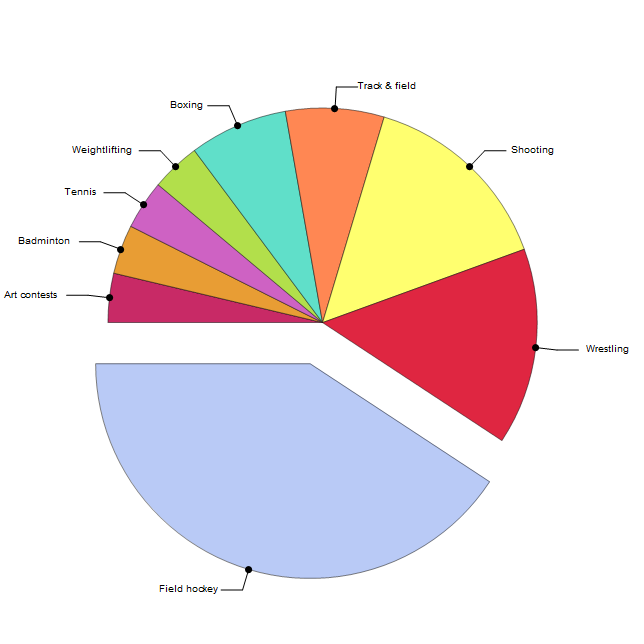
India's Distribution of Medals by Sport from 1900--2012
allIndiaMedals = Join[medalsBySport["India",#]&/@olympicyears,medalsBySport["British India",#]&/@olympicyears];
aggregateMedals[allIndiaMedals]~SortBy~Last;
chartifyMedalsBySport[%];
United Kingdom's Distribution of Medals by Sport from 1896--2012
allUKMedals = medalsBySport["United Kingdom",#]&/@olympicyears;
aggregateMedals[allUKMedals]~SortBy~Last;
chartifyMedalsBySport[%]
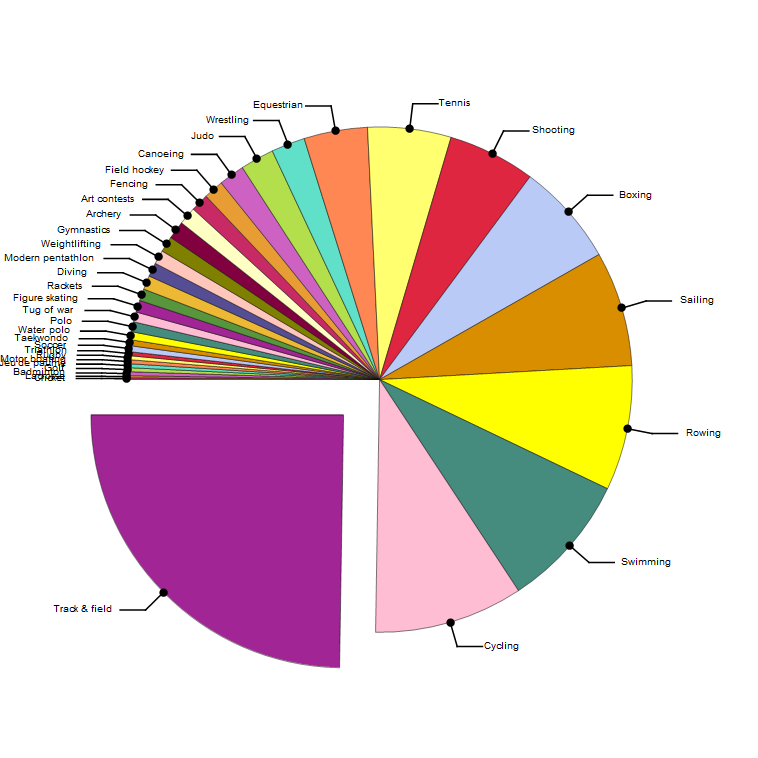
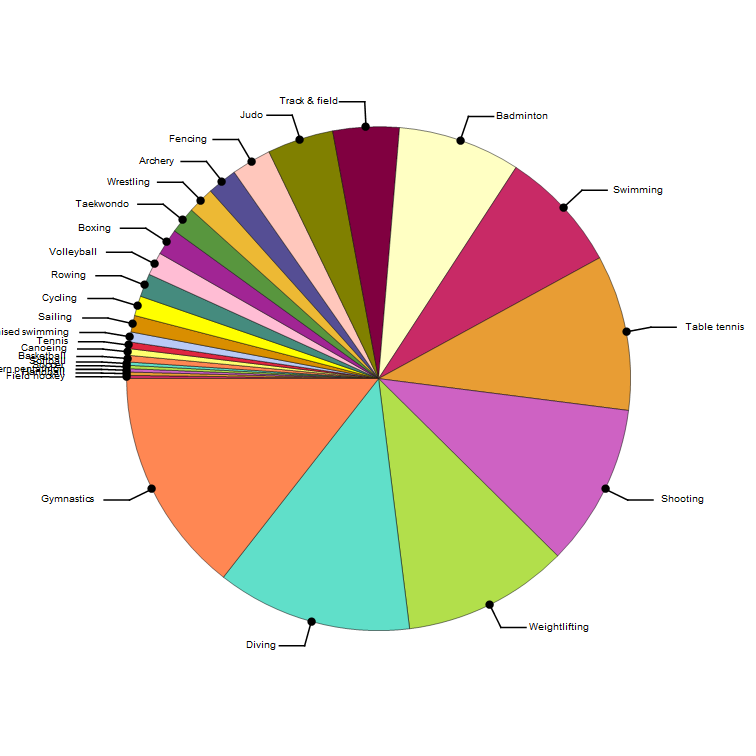
United States's Distribution of Medals by Sport from 1896--2012
allUSMedals = medalsBySport["United States",#, Switch[#,1904, 9, 1984,7,_,99]]&/@olympicyears;
aggregateMedals[allUSMedals]~SortBy~Last;
chartifyMedalsBySport[%]
China's Distribution of Medals by Sport from 1932--2012
allChinaMedals = medalsBySport["China",#]&/@ olympicyears;
aggregateMedals[allChinaMedals]~SortBy~Last;
chartifyMedalsBySport[%]
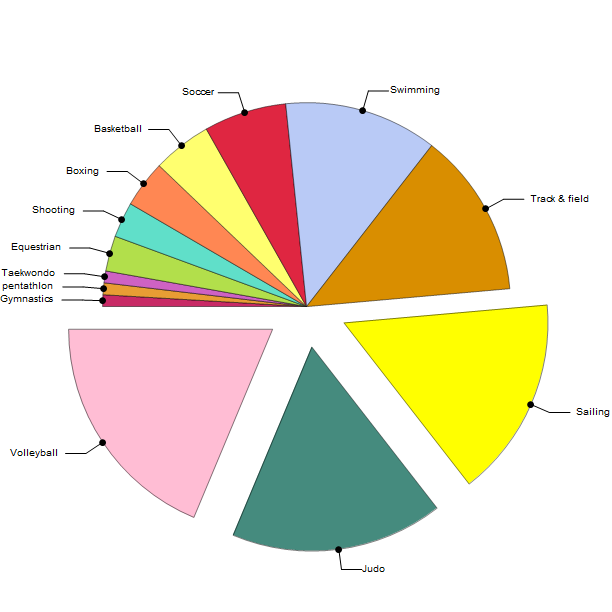
Brazil's Distribution of Medals by Sport from 1920--2012
allBrazilMedals = medalsBySport["Brazil",#]&/@olympicyears;
aggregateMedals[allBrazilMedals]~SortBy~Last;
chartifyMedalsBySport[%]
Putting a Ring on It
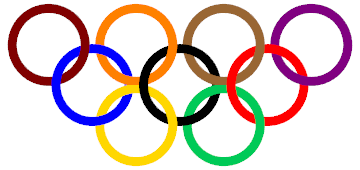
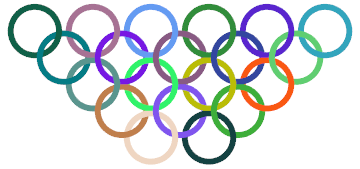
I want to wrap up on something a little fun. I'll confess: when I first thought about writing this post, there was a completely non-data science object I had in mind: the five interlocking Olympic rings. According to the father of the modern Olympics, Pierre de Coubertin, the Olympic symbol's six colors---including the white background---match the six colors you could find on the flags of the nations at the first modern Olympics in 1896. And I have no complaints about it---the icon has survived over a century and immediately resonates with people all over the world. But the mathematician inside me can't help but want to expand and generalize a construct when I see it, and that includes the Olympic rings.
First, what colors do I use now? This list can vary depending on how closely colors are lumped together. For this example, I decided to simply pull colors from Wikipedia's List of Flags by Color Combinations. Using this method, the original colors---white, black, blue, red, green and yellow---are joined by maroon (found on Qatar's flag), purple/violet (found on Dominica's flag) and orange (found on Spain's flag).
Next, the structure. Looking at the Olympic rings, I noticed that they closely resemble triangular numbers. While definitely a little bit of overkill, I can find a shape for a generalized ring structure for any number of rings $R$ by finding two triangular numbers, $T_m$ and $T_n$, such that $T_m - T_{n-1} = R$.
triangularNumber[x_] := x (x + 1)/2

Solve[{m>=1,n>=1,triangularNumber[m]-triangularNumber[n-1]== 9},{m,n},Integers]

{{m -> 4, n -> 2}, {m -> 5, n -> 4}, {m -> 9, n -> 9}}
Last, drawing the new rings. I adapted a Wolfram Language solution by J. M. on the mathematica.stackexchange community for drawing Olympic rings and expanded it to work with multiple rows.
circ=Cases[ParametricPlot3D[{Cos[t],Sin[t],Cos[3t]},{t,0,2 Pi}],_Line,Infinity][[1,1]];
min = 2;
max = 4;
colorNames = {"Gold","Emerald", "Blue","Black","Red","Maroon","Orange","Brown", "Purple"};
colors = Interpreter["Color"]/@colorNames;
coloriter = 1;
Graphics3D[
  Table[{Directive[Black,Glow[colors[[coloriter++]]]],
    Tube[Composition[TranslationTransform[{12(max-i)+24j,11(i-min),0}/10], RotationTransform[Mod[i,2]*Pi/3,{0,0,1}]]/@ circ, 1/8]},
    {i,min,max},{j, 1,i}],
  Method->{"TubePoints"->30}, ViewPoint->{0,0,Infinity}, Boxed->False]
As an aside, J. M.'s solution is quite cheeky in how it gets the circles to interlock. I encourage you to try out the code snippet above, as you will likely quickly discover that there is some 3D trickery going on, and the interlocking circles are hardly circles at all!

So if it is ever decided that we really need 20 or more rings for the Olympic icon, there'll be some code right here on the Wolfram Community waiting for its opportunity to shine.
Conclusion
No matter what your interest is in the Olympics---calculating home-field advantages, comparing athletes or creating visualizations and graphics to commemorate the occasion---there is no need to wait for someone else to publish the results. I hope you've found this interesting; feel free to share any comments or ideas you have! With 2016 Olympic data pouring into Wolfram|Alpha and the 2018 Winter Olympics in PyeonChang around the corner, I'm already gearing up to see what else I can do!


