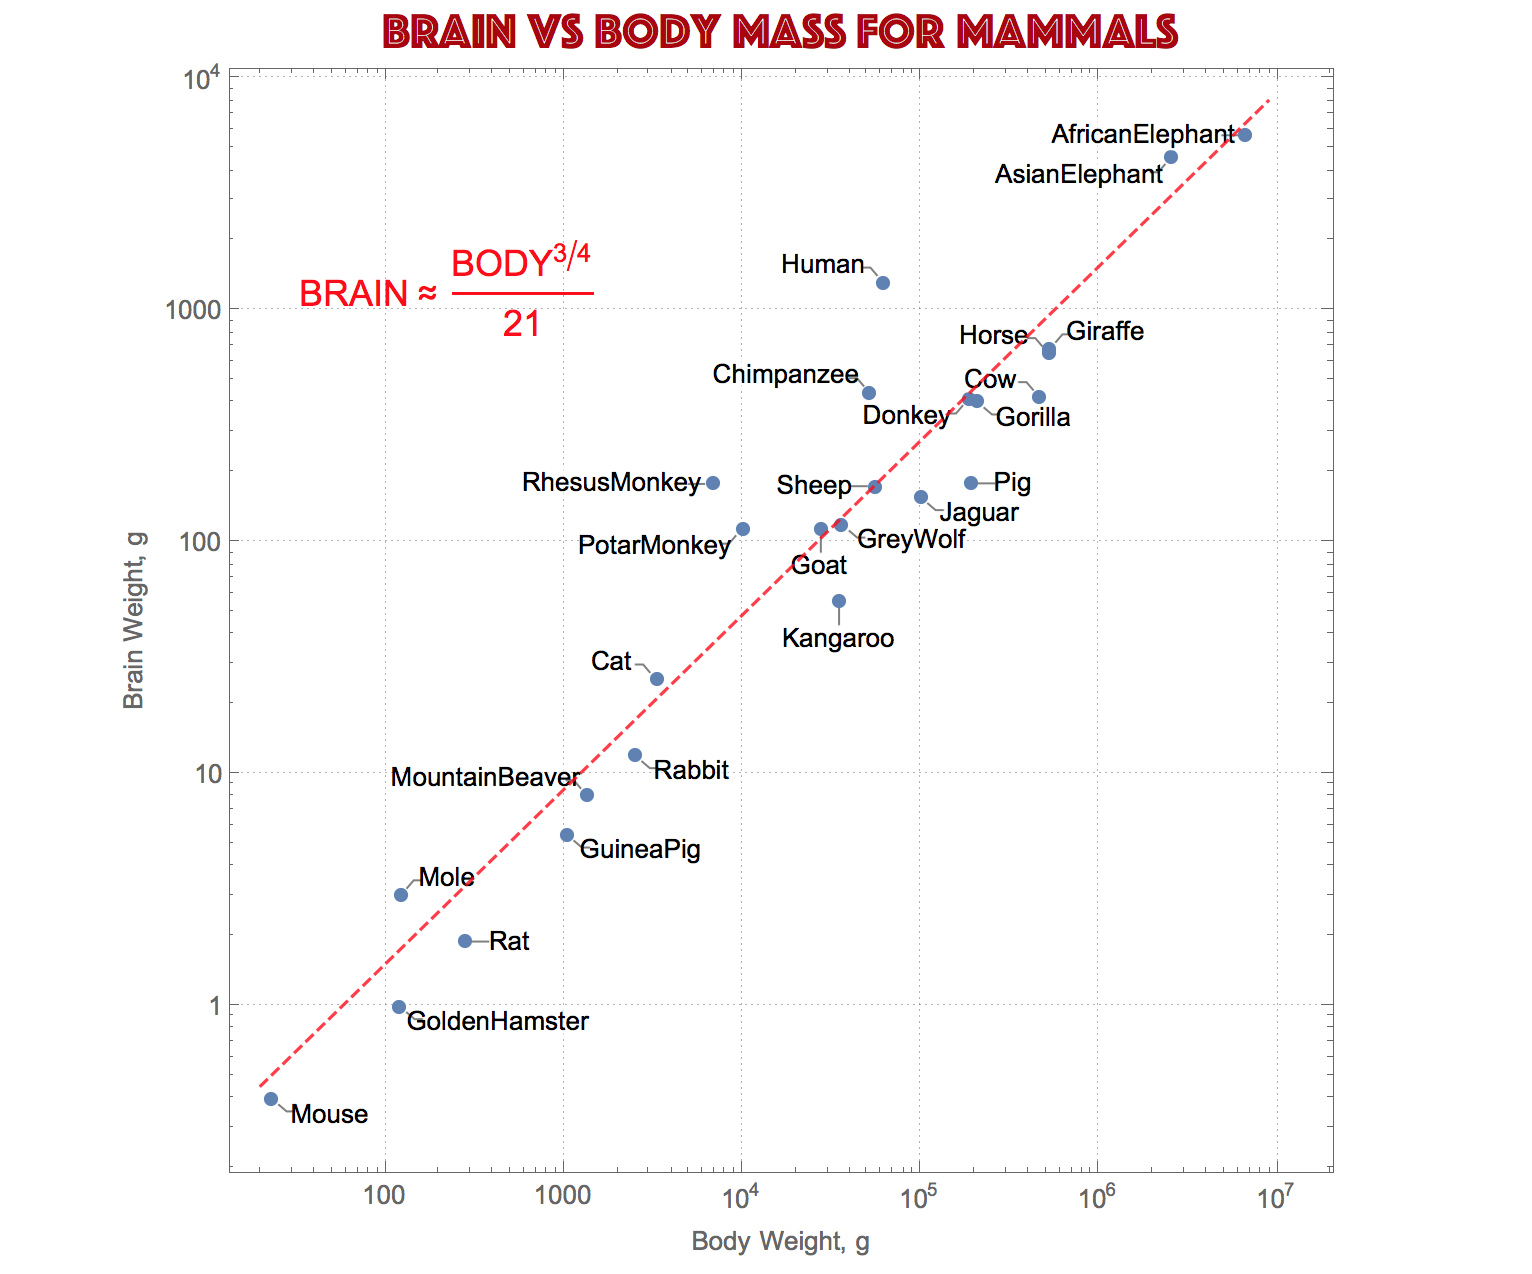
It's quite amazing that humans can abstract patterns in nature and see similarities between, for example, pigmentation of some mollusc shells and cellular automata. The amazement deepens as we discover that mathematical relations and simple programs can grasp the essence of numerous patterns. Below is an example. A "line" is one of the simplest patterns in nature and is easily caught by human eye. So it is quite miraculous to see points with coordinates (brain mass, body mass) for various mammals would suddenly arrange along a straight line in log-log coordinate system. Which right away implies a power or scaling mathematical law that is very universal in nature. It is known as Snell's equation in simple allometry due to Otto Snell (1891). It's not to be confused with Snell's law of optics due to Willebrord Snell (1621). Let's see how we can build this wonderful plot.
I start from searching Wolfram Language built-in data resources for animal-related sets:
ResourceSearch["animal"]
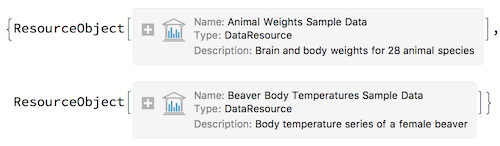
Let's grab the first one:
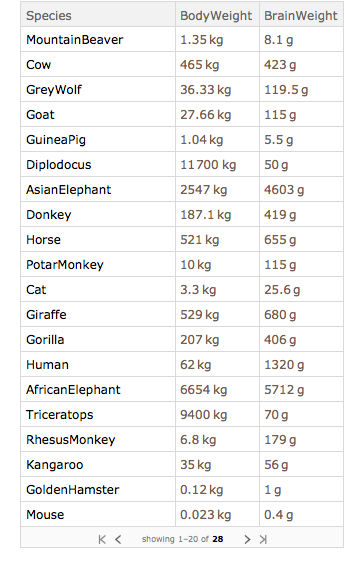
data = ResourceData["Animal Weights Sample Data"]
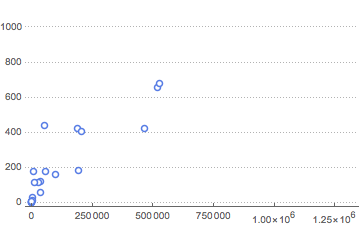
A simple plot of brain vs body mass does not reveal anything obvious:
ListPlot[Normal[data[All, {1000 #BodyWeight, #BrainWeight} &]], PlotTheme -> "Business"]
And by browsing the data we see we got a few long-dead species:
Interpreter["Dinosaur"][{"Diplodocus", "Triceratops", "Brachiosaurus"}]

EntityValue[%, "Image"]
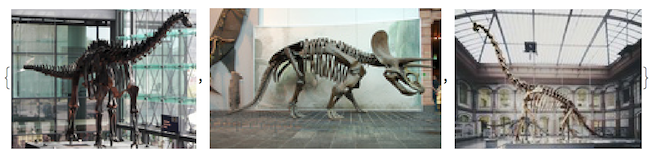
Let's delete these old friends and concentrate on modern species:
modern = Delete[data, {{6}, {16}, {26}}];
and find equation of line passing through the log of data points:
f[x_] = Fit[Log[QuantityMagnitude[
    Normal[modern[All, {1000 #BodyWeight, #BrainWeight} &]]]], {1, x},x]

Out[]= -3.04602 + 0.752261 x
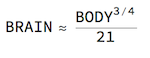
Getting it back into Snell's equation power-from I get:
eq = Rationalize[BRAIN ? First[BRAIN /.
     Solve[(f[x] /. x -> Log[BODY]) == Log[BRAIN], BRAIN]], .01]
And now to make the final plot above we use ListLogLogPlot:
Show[
    ListLogLogPlot[Normal[modern[All,Callout[{1000#BodyWeight,#BrainWeight},#Species]&]],
       PlotTheme->"Detailed",AspectRatio->1],
       Plot[f[x],{x,3,16},PlotStyle->Directive[Red,Dashed,Opacity[.8]]],
       BaseStyle->13,
       PlotLabel->Style["brain vs body mass for mammals",25,Darker[Red],FontFamily->"Phosphate"],
       FrameLabel->{"Body Weight, g","Brain Weight, g"},
       Epilog->Inset[Style[eq,18,Red],Scaled[{.2,.8}]]
]
Of course, the mathematical formula is just an approximation and the constants change slightly for a different set of animals. For instance, according to Harry J. Jerison (UCLA):
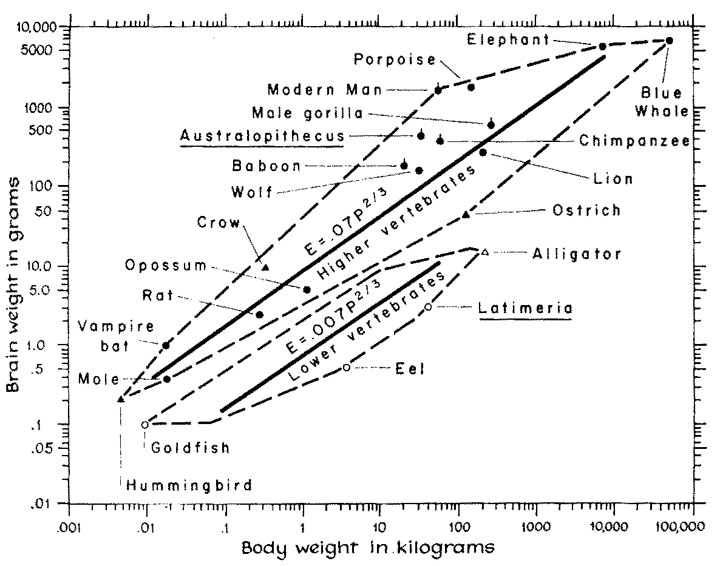
Further reading:


