Message Boards Message Boards

[GIF] Weierstrass Fractal

Posted 8 years ago

enter image description here

enter image description here

I call it a Weierstrass fractal because it resembles the Weierstrass Function: enter image description here

plaht[d_] := ParametricPlot[
  Sum[If[Floor[d] == k, FractionalPart[d], 
     1] {(2/3)^k Sin[3^k t], (2/3)^k Cos[3^k t]}, {k, 0, Floor[d]}]
  , {t, 0, 2 Pi}, PlotRange -> {{-2.2, 2.2}, {-3, 3}}, Axes -> False, 
  PlotPoints -> 50 + Floor[d^5.03], MaxRecursion -> 5, 
  PlotStyle -> {Thickness[
     Piecewise[{{0.015 - (0.0135 d)/8, 
        d < 8}, {0.0015 + 0.00144 (0.04 (d - 13)^2 - 1), d >= 8}}]], 
    Cyan}, Background -> GrayLevel[0.4 (13 - d)/13], 
  ImageSize -> {400, Automatic}]

Export the frames (to make the GIF):

Do[Export[StringJoin[ToString[i, InputForm], ".png"], plaht[i/30]], {i, 0, 390, 1}]

Play with it:

Manipulate[plaht[d],{d,0,13}]
POSTED BY: Bryan Lettner
3 Replies

enter image description here - you have earned "Featured Contributor" badge, congratulations !

This is a great post and it has been selected for the curated Staff Picks group. Your profile is now distinguished by a "Featured Contributor" badge and displayed on the "Featured Contributor" board.

POSTED BY: Moderation Team

Wow, beautiful idea and structure. I also think the color method is neat.

POSTED BY: Sam Carrettie
Posted 8 years ago

The coloring at the end of the gif was done with a combination of:

Colorize[(image)]
ColorNegate[(image)]
ImageApply[RotateLeft,(image)]
ImageApply[4 #^1 (1 - #^1) &,(image)]

Experimenting with different values for the exponent of the # helps to fine-tune the color.

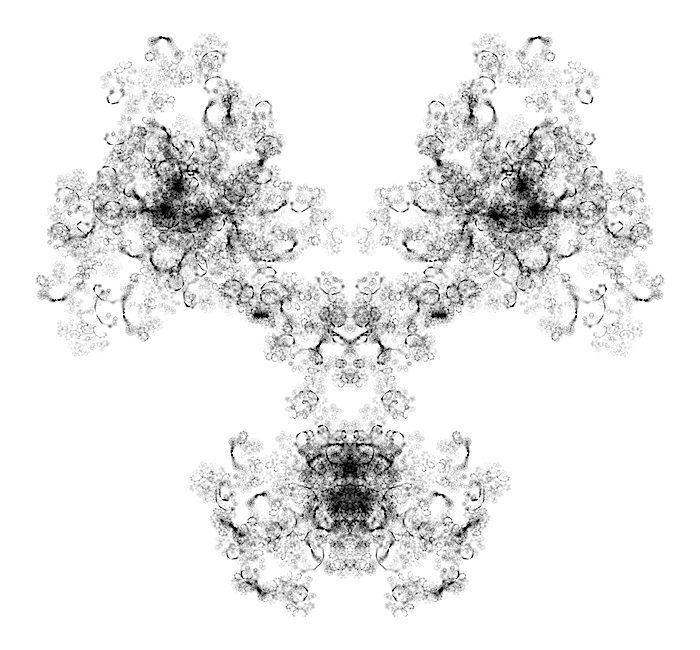
Also, many interesting variations of this type of fractal are possible. Here is one variation:

enter image description here enter image description here

c1 = 2;
c2 = 3;
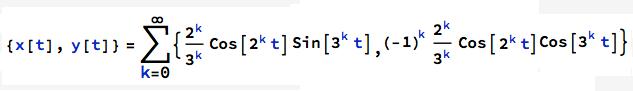
fractal[d_] := ParametricPlot[
  Sum[If[Floor[d] == k, FractionalPart[d], 
     1] {(c1/c2)^k Cos[c1^k t] Sin[c2^k t], (-(c1/c2))^
      k Cos[c1^k t] Cos[c2^k t]}, {k, 0, Floor[d]}]
  , {t, 0, 2 Pi}, PlotRange -> {{-1.5, 1.5}, {-0.84, 1.91}}, 
  Axes -> False, PlotPoints -> 50 + Floor[d^5.03], MaxRecursion -> 5, 
  PlotStyle -> {Thickness[
     Piecewise[{{0.015 - (0.0135 d)/8, 
        d < 8}, {0.0015 + 0.00144 (0.04 (d - 13)^2 - 1), d >= 8}}]], 
    LightBlue}, Background -> GrayLevel[0.4 (13 - d)/13], 
  ImageSize -> {400, Automatic}]

Manipulate[fractal[d], {d, 0, 10}]

We can choose any values for c1 and c2. For example, here is the plot for c1=3 and c2=7 :

enter image description here

POSTED BY: Bryan Lettner
Reply to this discussion
Community posts can be styled and formatted using the Markdown syntax.
Reply Preview
Attachments
Remove
or Discard

Group Abstract Group Abstract