Message Boards Message Boards

0
|
15503 Views
|
4 Replies
|
2 Total Likes
View groups...
Share
Share this post:

Visualize triple integrals?

Posted 8 years ago

I am trying to visualize a triple integral using various Mathematica commands without any success. My limits of integration consist of variables as well as numbers (See Attached). However, Mathematica does not allow entering variables as ranges in either the Plot3D or RegionPlot3D commands. Is there another Mathematica command that I should be using, or is there a method of entering variables in ranges that I should use?

I am using Mathematica 11.

Thanks

Integrate[1,{z, 0, 3}, {x, 0, 4 - (4*z)/3},{y, 0, 2 - x/2 - (2*z)/3}]

Plot3D[2 - x/2 - (2*z)/3, {x, 0, 4 - (4*z)/3}, {z, 0, 3}]

RegionPlot3D[1, {y, 0, 2 - x/2 - (2*z)/3}, {x, 0, 4 - (4*z)/3},{z, 0, 3}]
Attachments:
POSTED BY: Mitchell Sandlin
4 Replies

Thanks so much, your explanation helps a lot. However, how would you plot the region of the integral if you wanting to integrate something more than just "1" (for volume). Say for example instead of integrating 1 you were integrating 3y. How would you incorporate the 3y into the "pred" along with the ranges? I tried several things trying to incorporate the 3*y and nothing that I tried seem to work.

POSTED BY: Mitchell Sandlin

You can try using NIntegrate to get integration sampling points and color for the function values.

sPnts = Reap[NIntegrate[1, {z, 0, 3}, 
       {x, 0, 4 - (4*z)/3}, 
       {y, 0, 2 - x/2 - (2*z)/3}, PrecisionGoal -> 6, 
     Method -> {"GaussKronrodRule", "Points" -> 12, 
       "SymbolicProcessing" -> 0}, 
     EvaluationMonitor :> Sow[{z, x, y}]]][[2, 1]];

Clear[f]
f[z_, x_, y_] := 3 y;
Graphics3D[
 MapThread[{Hue[#1], Point[#2]} &, {Rescale[f @@@ sPnts], sPnts}], 
 Axes -> True, AxesLabel -> {"z", "x", "y"}, 
 FaceGrids -> {{-1, 0, 0}, {0, 0, -1}}]

enter image description here

POSTED BY: Anton Antonov

Either

r = ImplicitRegion[0 <= x <= 4 - (4*z)/3 && 0 <= y <= 2 - x/2 - (2*z)/3 && 
    0 <= z <= 3, {x, y, z}];
Integrate[3 y , {x, y, z} \[Element] r]

Or

Integrate[3y Boole[
   0 <= x <= 4 - (4*z)/3 && 0 <= y <= 2 - x/2 - (2*z)/3 && 
    0 <= z <= 3], {x, -Infinity, Infinity}, {y, -Infinity, 
  Infinity}, {z, -Infinity, Infinity}]
POSTED BY: Emerson Willard

Everything you need to know is in the documentation. enter image description here

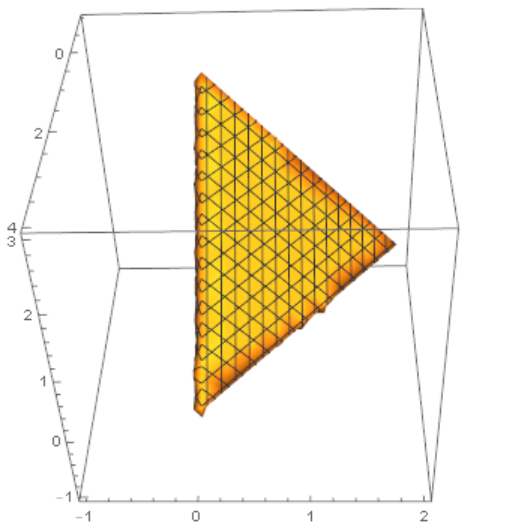
You need to represent your region as as a Boolean expression that defines the points in space that you want integrate over. This is your predicate and is the first argument of RegionPlot3D . The remaining arguments for x,y and z just specify what you will see when the plot is rendered.

RegionPlot3D[
 0 <= x <= 4 - (4*z)/3 && 0 <= y <= 2 - x/2 - (2*z)/3 && 0 <= z <= 3, {x, -1, 4}, {y, -1, 2}, {z, -1, 3}]

enter image description here jj

Since your integral could represent a volume you can compute the volume of your implicit region.

r = ImplicitRegion[0 <= x <= 4 - (4*z)/3 && 0 <= y <= 2 - x/2 - (2*z)/3 &&  0 <= z <= 3, {x, y, z}];
RegionPlot3D@r
Volume@r

Alternatively, this very nice as well.

Integrate[1, {x, y, z} \[Element] r]

Or perhaps most economically

1/3*(1/2*4*2)*3
POSTED BY: Emerson Willard
Reply to this discussion
Community posts can be styled and formatted using the Markdown syntax.
Reply Preview
Attachments
Remove
or Discard

Group Abstract Group Abstract