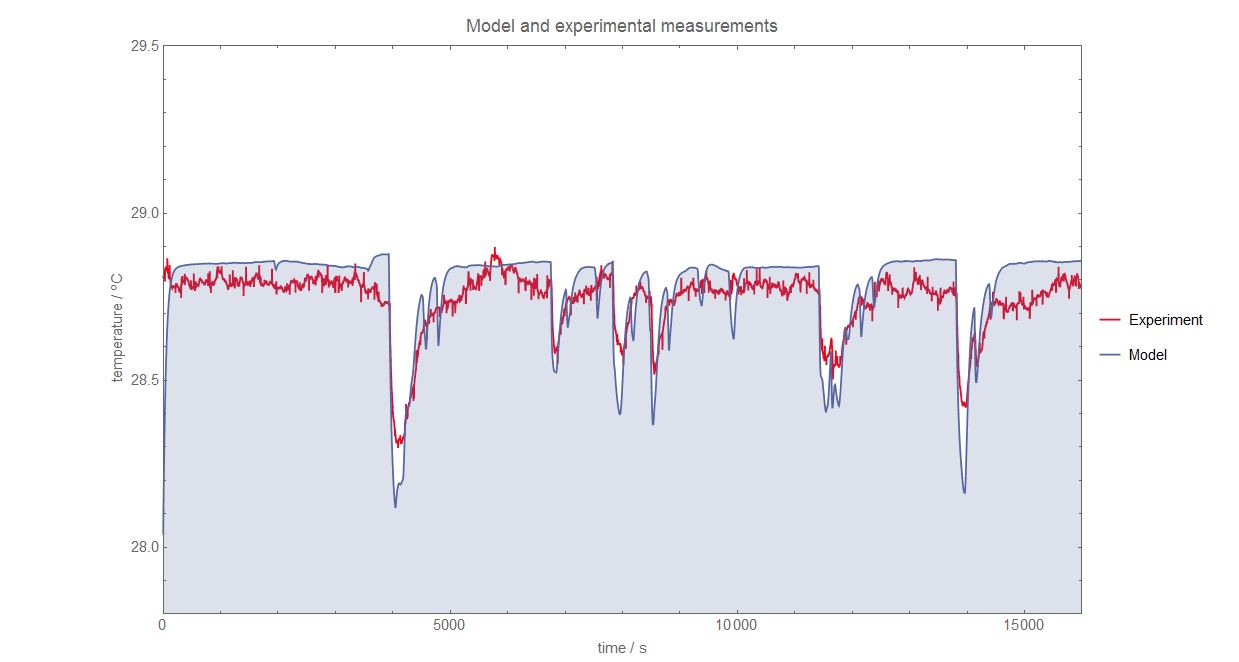
Is there any way to overwrite the x-axis values in a plot?
I have numerical solution to a differential equation, the solution is plotted against time in seconds. However, I want to change the x-scale of my plot to show minutes, without having to go back and solve the differential equation again.
Plot[Evaluate[(((y[x]) /. solutionNum))], {x, 0, signalLength},
       PlotRange -> {{0, signalLength}, {All, All}},
       FrameLabel -> {"time / s", "temperature / ºC" }, PlotLegends -> {"Model"}];
I want to overwrite the x-axis values to show for instance 0-250 minutes, and not 0-15000 seconds, without having to redo my soluton .
Thanks in advance! 