Hello, Let's assume I have something like this
xcoor = Range[1, 2, 1/2];
ycoor = Range[3, 4, 1/2];
(x + y /. x -> xcoor) /. y -> ycoor
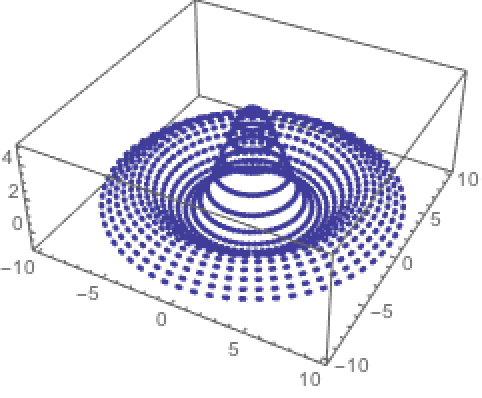
These can be values of a 2D function (xcoor,ycoor) for given x and y coordinates. I can't use directly the function for plotting for IP reasons. I can only use the points that are evaluated at and I would like to have a plot looking like this
data1 = Flatten[
Table[{r Cos[t], r Sin[t], 5 Sinc[r]}, {r, 0, 10, 0.5}, {t, -Pi,
3 Pi, 0.1}], 1];
data2 = ExampleData[{"Geometry3D", "Torus"}, "VertexData"];
ListPointPlot3D[data1]
I could not find a way to do that, I was unable to convert that list to a table. I know there should be one.
Thank you


