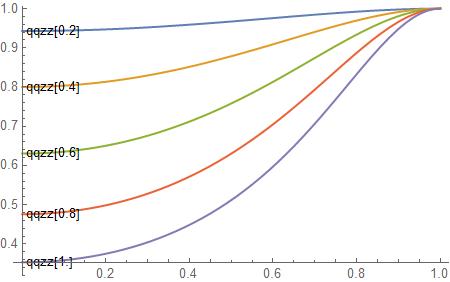
When I run corrected code on version 11.1.1.0 on Win 7 x64 it produces the expected output, as seen below.
In the future, please put code in code bocks as noted in the group rules.
lmt=10;
qq[zets_]=1/Sqrt[1+zets^2]^3;
zets[rr_,eps_,eta_]=eps(1-rr^2) (1+eta (1+rr^2));
demcurves=Array[qq[zets[rr,2 #/lmt,0]]&,lmt/2];
Plot[demcurves,{rr,0,1}];
demlabels=Map[ToString,Array[qqzz[N[2/lmt]#]&,lmt/2]];
Plot[demcurves,{rr,0,1},PlotLabels->Placed[demlabels,Left]]