GOAL OF THE PROJECT:
Create the rule-space of L-scale notes with n neighbouring notes and observe the patterns and distributions created after a number of iterations on the space of initializations.
Additionally, create a list of enumerated primitives that act on musical notes and observe the structure and patterns that emerge when they are applied continuously. This list will cover elementary actions such as inversion, retrograde, dimunition, and scale shifting. Furthermore, these rules will be applied randomly to create a musical composition.
SUMMARY OF WORK: (L-Note Rule-Space)
For the musical rule characterization, a function was created to generate the path a set of notes will follow given a rule.
    rule[rulenumber_, n_] :=
      AssociationThread[
       Tuples[Range[0, L], n] -> IntegerDigits[rulenumber, L, L^n]];
An L-note scale was used to implement this function. The function considers the past n-notes as neighbors and generates an enumerated ruleset which one may choose from to create the pattern. First, the rules must be enumerated based on the number of neighbors, n: there exist 12 different outputs for each of the rules, each with n neighbors that have L different outputs as well; thus the total number of rules is (L^(L^n)). Next, a function was created to append the new note to the list based on the previous ** neighbours.
note[rulenumber_, init_, n_] := Append[init,
   Lookup[
     rule[rulenumber,
      n], {Part[init, Length[init] - (n - 1) ;; Length[init]]}][[1]]
   ];
This function was then nested to be able to apply the function to the initial conditions m times.
notelist[rulenumber_, init_, n_, m_] :=
  Nest[note[rulenumber, #, n] &, init, m];
Then for a given rule, a function is created to apply the rule to all of the possible initial conditions with n neighbours m times.
initset[n_] := Tuples[Range[0, 11], n];

completenotelist[rulenumber_, n_, m_] :=
  Table[notelist[rulenumber, initset[n][[i]], n, m], {i, 1,
    Length[initset[n]]}];
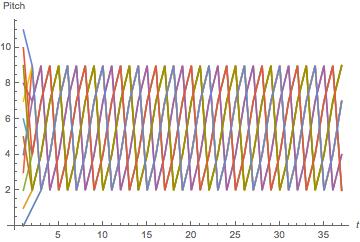
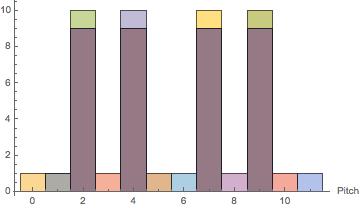
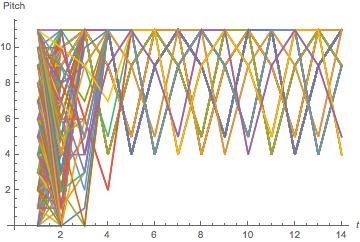
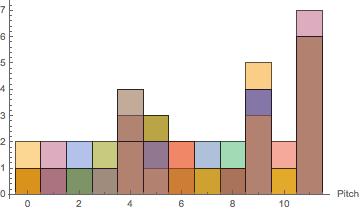
These sets are then plotted with a ListLinePlot and the distribution of the amount of time spent on a single note is visualized with a Histogram.
noteplot[rulenumber_, n_, m_] :=
 ListLinePlot[completenotelist[rulenumber, n, m],
  AxesLabel -> {t, Pitch}]

notehist[rulenumber_, n_, m_] :=
 Histogram[completenotelist[rulenumber, n, m], AxesLabel -> {Pitch}]
An example of some of the graphics are shown below:
1-Note Neighbourhood
2-Note Neighbourhood
 Attachments:


