GOAL OF THE PROJECT:
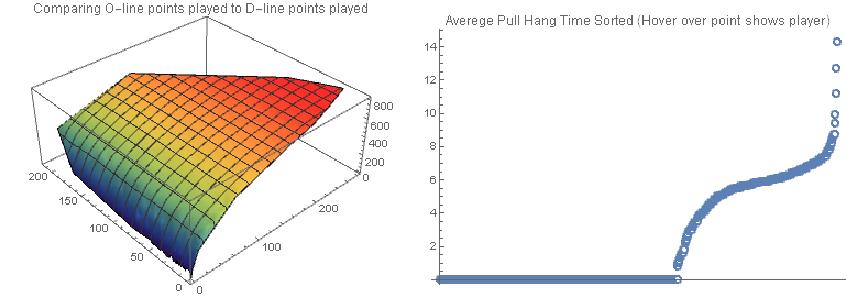
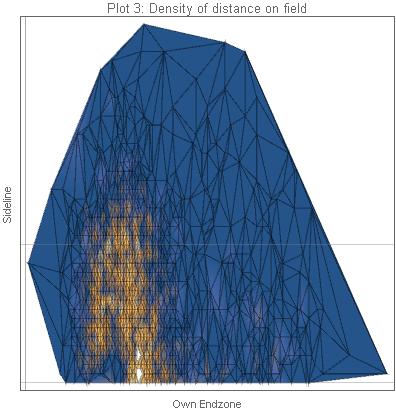
The goal of this project is to submit raw Ultimate Frisbee data to the Wolfram Data Repository and also analyze different Ultimate Frisbee statistics. The plots shown above show the best comparison for all players from teams that were a part of the AUDL 2017 season.
SUMMARY OF WORK:
Practiced visualization and curating data into a dataset by using raw data from the paper titled Spatial Statistics to Evaluate Player Contribution in Ultimate written by Jeremy C. Weiss, Sean Childers.
Submitted raw Ultimate Frisbee data from the source UltiAnalytics to the Wolfram Data Repository.
Visualized various statistics from UltiAnalytics; specifically comparing stats from the AUDL teams from the 2017 season.
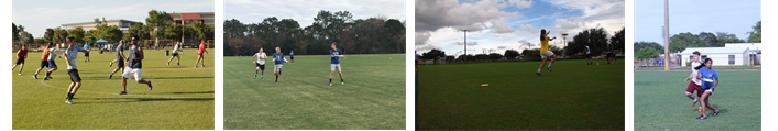
Practiced creating graphics to show how Ultimate Frisbee is played and to help explain the game concept.
RESULTS AND FUTURE WORK:
Create a microsite that visualizes team statistics, submit additional raw Ultimate Frisbee data, create simulation of throwing the disc and create simulation of an actual game.
Details about the project
What is Ultimate Frisbee?
As defined by USA Ultimate, combining the non-stop movement and athletic endurance of soccer with the aerial passing skills of football, a game of ultimate is played by two teams with a flying disc on a field with end zones, similar to football. The object of the game is to score by catching a pass in the opponent's end zone. A player must stop running while in possession of the disc, but may pivot and pass to any of the other receivers on the field. Ultimate is a transition game in which players move quickly from offense to defense on turnovers that occur with a dropped pass, an interception, a pass out of bounds, or when a player is caught holding the disc for more than ten seconds. Ultimate is governed by Spirit of the Game[Trademark], a tradition of sportsmanship that places the responsibility for fair play on the players rather than referees.
The AUDL (American Ultimate Disc League) and MLU (Major League Ultimate) are semi-pro leagues composed of men's Ultimate Frisbee teams. The AUDL is composed of 25 teams divided into four geographic divisions. The MLU is composed of eight teams divided into two geographic division. USA Ultimate is the national governing body for ultimate in the United States. USAU runs a club series for men's teams, women's teams, and mixed gender teams, which is open to any team that wishes to participate.
Why choose this topic?
The reason I chose this topic is because I have a passion for playing Ultimate Frisbee and I am a part of two competitive teams. I have always had an interest in both sports and technology and always try to figure out ways to combine the two. I have also never worked with big data before, so the visualizing part was interesting and since I am into graphic design, the animation part was fun to learn.
The steps taken to complete my journey through the Wolfram Summer School
Step 1: Practice visualization and curating data into a dataset by using raw data from the paper titled Spatial Statistics to Evaluate Player Contribution in Ultimate written by Jeremy C. Weiss, Sean Childers who both collected Ultimate Frisbee data and they leveraged sequential, location-based data to build scoring probability maps that aggregate possession outcomes with a function of location. Both have all rights to the data.
Step 2: Submit raw Ultimate Frisbee data to the Wolfram Data Repository (since there is no data currently). Data was gathered from the website http://www.ultianalytics.com/index.html. The raw data that was gathered was then converted into a Dataset object and saved as an mx file.
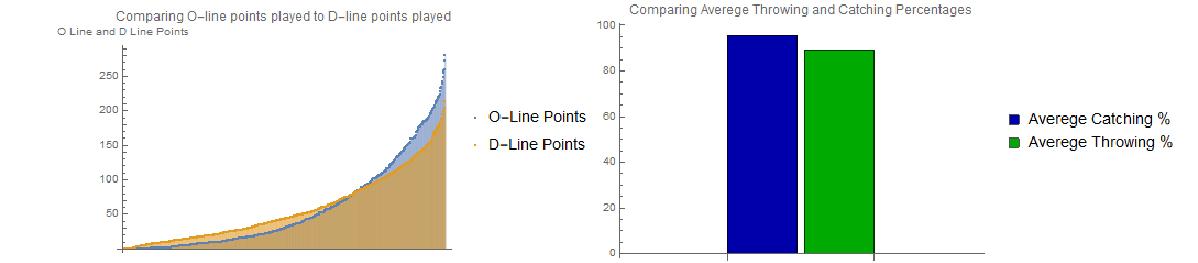
Step 3: Visualize various statistics from UltiAnalytics; specifically comparing stats of the AUDL teams from the 2017 season. UltiAnalytics users create one or more teams in the mobile app and gather stats as the game is in progress. The user can upload the statistics to their team website (provided) at any time. Comparisons I made include: Comparing O-line points played to D-line points played, Comparing throwing percentages to catching percentages and Comparing Avg Pull Hang Time.
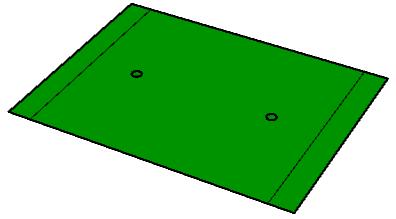
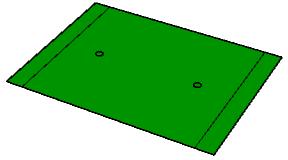
Step 4: Create basic graphics to show how the game is played
Typical Ultimate Frisbee Field Setup (Not to scale) Field: 70 yards x 40 yards End Zone 25 yards deep Brick Marks- 18 m from end zone
Main Results in Detail
The main takeaway from this project was learning how to work with big datasets and learning about the data curation process. Having a passion for Ultimate Frisbee, it made curating data very enjoyable and gave me insight into the data science world. It was interesting to learn about different players and how their stats compare to each other. Analyzing the data also helped me understand how I can improve my set of Ultimate Frisbee skills and that is valuable insight one can't get anywhere else. It was also exciting to actually create and format a dataset that will eventually be able to be used by everyone.
Main conclusions come from Step 3, where I focused on comparing O-line points played to D-line points played, throwing percentages to catching percentages and average pull hang time. The statistical data I found the most interesting was the average pull hang time comparison. Pulling is an underrated, incredibly important and frequently difficult task for one of the seven players on every defensive line of a game. If you're pulling for your team, you should be constantly reading both the wind and other team's offense to try and learn what the best type of pull is to get their offense to a slow or disrupted start.
A good puller does 3 things well
They throw the disc far Throw the disc high Throw the disc accurately
When there is a longer pull time, that means the defense has more time to set up and has a better chance of defending the point. The ListPointPlot shows the average pull hang times based on the number of times a player has pulled. Hovering over a point in the graph displays player's name.
Although I did not have enough time to do the simulation I wanted, I still learned about Graphics and Animation and found it fascinating how you can create complex Graphics in Mathematica. Creating the field was a challenge but in the end it worked out. Being a Wolfram Technical Student Ambassador, I will have to work on project anyways and I plan to continue this project and get the simulation working and keep submitting data to the Wolfram Data Repository.
Step 4 Code
Graphics about Ultimate Frisbee
ultimatefrisbeefield = Graphics3D[{
   Line[{{-10, -45, -2.44}, {-10, 45, -2.44}}],(* endzone 1 *)
   Line[{{-110, -45, -2.44}, {-110, 45, -2.44}}],(* endzone 2 *)
   Glow[], Darker[Green], EdgeForm[{Thick, Black}],
   Polygon[{{-120, -45, -2.44}, {-120, 45, -2.44}, {0,
      45, -2.44}, {0, -45, -2.44}, {-120, -45, -2.44}}] (* Field *),
   Cylinder[{{-30, 0, -2.4401}, {-30, 0, -2.44}}, 2] (* Brick Mark *),
   Cylinder[{{-90, 0, -2.4401}, {-90, 0, -2.44}}, 2] (*
   Brick Mark *)
   }]; Show[ultimatefrisbeefield, Boxed -> False]
(* Field: 70 yards x 40 yards *)
(* End Zone 25 yards deep *)
(* Brick Marks- 18 m from end zone *)
Although I did not have enough time to do the simulation I wanted, I still learned about Graphics and Animation and found it fascinating how you can create complex Graphics in Mathematica. Creating the field was a challenge but in the end it worked out. Being a Wolfram Technical Student Ambassador, I will have to work on project anyways and I plan to continue this project and get the simulation working and keep submitting data to the Wolfram Data Repository.
GitHub Link https://github.com/pk285/Final-Project-Kacham
Conclusions in Detail
- Practiced visualization and curating data into a dataset by using raw data from the paper titled Spatial Statistics to Evaluate Player Contribution in Ultimate written by Jeremy C. Weiss, Sean Childers.
- Submitted raw Ultimate Frisbee data from the source UltiAnalytics to the Wolfram Data Repository.
- Visualized various statistics from UltiAnalytics; specifically comparing stats from the AUDL teams from the 2017 season.
- Practiced creating graphics to show how Ultimate Frisbee is played and to help explain the game concept.
Data Sources Links/References
http://www.ultianalytics.com/index.html UltiAnalytics is a mobile (iOS and Android) app and web site for tracking statistics for your ultimate team(s). Users create one or more teams in the mobile app and gather stats as the game is in progress. The user can upload the statistics to their team website (provided) at any time. The app also features a Twitter interface that allows the user to "auto-tweet" game events as they happen.
Weiss, J. C., & Childers, S. (n.d.). Spatial Statistics to Evaluate Player Contribution in Ultimate. Retrieved July 5, 2017, from http://www.sloansportsconference.com/wp-content/uploads/2014/02/2014-SSAC-Spatial-Statistics-to-Evaluate-Player-Contribution-in-Ultimate.pdf
 Attachments:


