This post was developed as part of the Final Project for the Wolfram Summer School 2017. Details beyond the scope of this post, project notebooks, and output figures are available here: https://wolfr.am/mDLMfxbm.
Special characters appear frequently in scientific articles, especially in the physical sciences and math. In fact, I think many of us can not imagine "doing science" without symbols such as \[Alpha], \[Beta] etc. But, this leaves some important questions! What does a special character mean? Which of these are the most common? Does their usage change over time? And, can the frequency of usage of special characters give us any hints about the scientific content of an article, or about where science might be headed? While a complete answer to most of these questions can only be obtained through a dedicated research project, in this project, we have made a beginning attempt to address some of them.
Let us take the issue of the meaning of a special character. In many fields it is clearly not unique. For example, in particle or nuclear physics the symbol \[Alpha] may stand for the fine-structure constant (Quantity[1, "FineStructureConstant"]), but it may also be used to represent an Alpha particle (Entity["Isotope","Helium4"]). And sometimes you may encounter a composite symbol that has a different usage, for example, Subscript[\[Alpha],s] is often used to represent the coupling strength between quarks and gluons (strong interaction). In order to classify special characters, therefore, we need to create an extensive dictionary between them and what they most commonly represent in scientific literature.
In order to create a correspondence between scientific fields and the special characters that are commonly used in these fields we started by analyzing articles from arXiv.org. In order to identify a source with some degree of homogeneity we referred to Mathematical REtreival Collection, based on arXMLiv (documents taken from arXiv.org but translated to XML). We further used some of the techniques that were previously used by Giorgia Fortuna in her interesting blog post titled "2 Pi or Not 2 Pi?". Our first task was to create a database consisting of symbols.
Creating a database and visualizing its components
The first task was to extract symbols from the corpus. This was done using the following code:
unwantedSymbols = FromCharacterCode /@ ({Range[168], 8201, 8211, 8217, 8220, 8221, 8242, 8243, 8289,
                    8290, Range[8593, 8601], 8764, 8805, 8818} // Flatten);
allSymbols[article_] := KeyDrop[Counts[Characters[Import[article, "Text"]]], unwantedSymbols];
Once the symbols in an article have been extracted (as an association with the symbols as Keys and frequencies as Values) one can use WordCloud to visualize this. Here is an example output of the WordCloud function, here it is for the symbols in the hep-ph arXives from 2006:

A simple animated visual for the evolution of WordClouds can also be made using Table and exporting the output to a .gif file. As an example we made the following visualization for the evolution of frequencies of special characters in the astro-ph arXives from 1995 till 2006:

In addition to symbols we also extracted the title of each paper. This was easier done by parsing the source files in their original ".xhtml" format imported to mathematica as an "XMLObject". The following code snippet was used to extract the title from the articles:
title[article_] :=
  StringReplace["\n" -> " "]@
   StringJoin@
    DeleteCases[
     Cases[Import[article, "XMLObject"],
      XMLElement[_, {"class" -> "title document-title"}, {title__}] :>
        title, \[Infinity]], XMLElement[_, _, _], \[Infinity]];
Clearly the data we extracted from the source files was voluminous and so the next step was to put them in a database using the Dataset command. We did this in several steps. First we created Datasets for each year using:
dataAssoc[year_, month_, arXiv_] :=
  Module[{numbers = UsingFrontEnd[arXivNumbersList[year, month, arXiv]],
    files = UsingFrontEnd[filePaths[year, month, arXiv]]},
      DeleteCases[Table[AssociationThread[{"Year", "Month", "Type", "Number", "Title", "Symbols"},
        {year, month, arXiv, numbers[[i]], title[files[[i]]], allSymbols[files[[i]]]}],
          {i, 1, Length[numbers]}], <|__, "Title" -> "", __|>]];
dataAssocallarXivs[year_, month_] := Flatten[Map[dataAssoc[year, month, #] &, arXivNamesList]];
dataset[year_] := Dataset[Flatten[ParallelMap[dataAssocallarXivs[year, #] &, Range[1, 12]]]];
We then collected the Dataset from every year to build a master database. The following is an example picture showing the fullDataset: 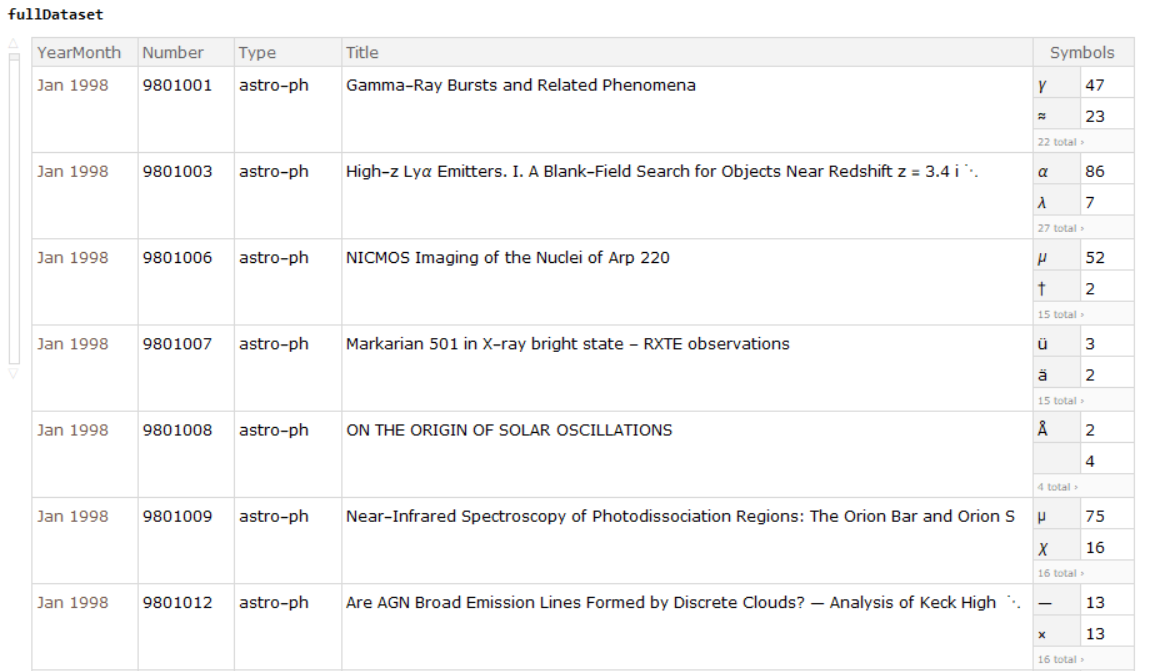
Using the full dataset it was much easier to go back to our favorite WordClouds (we also used other visualization techniques such as ClusteringTree and DateListStepPlot). Here's a picture that combines word clouds from every different arXiv type from 1998 till 2006: 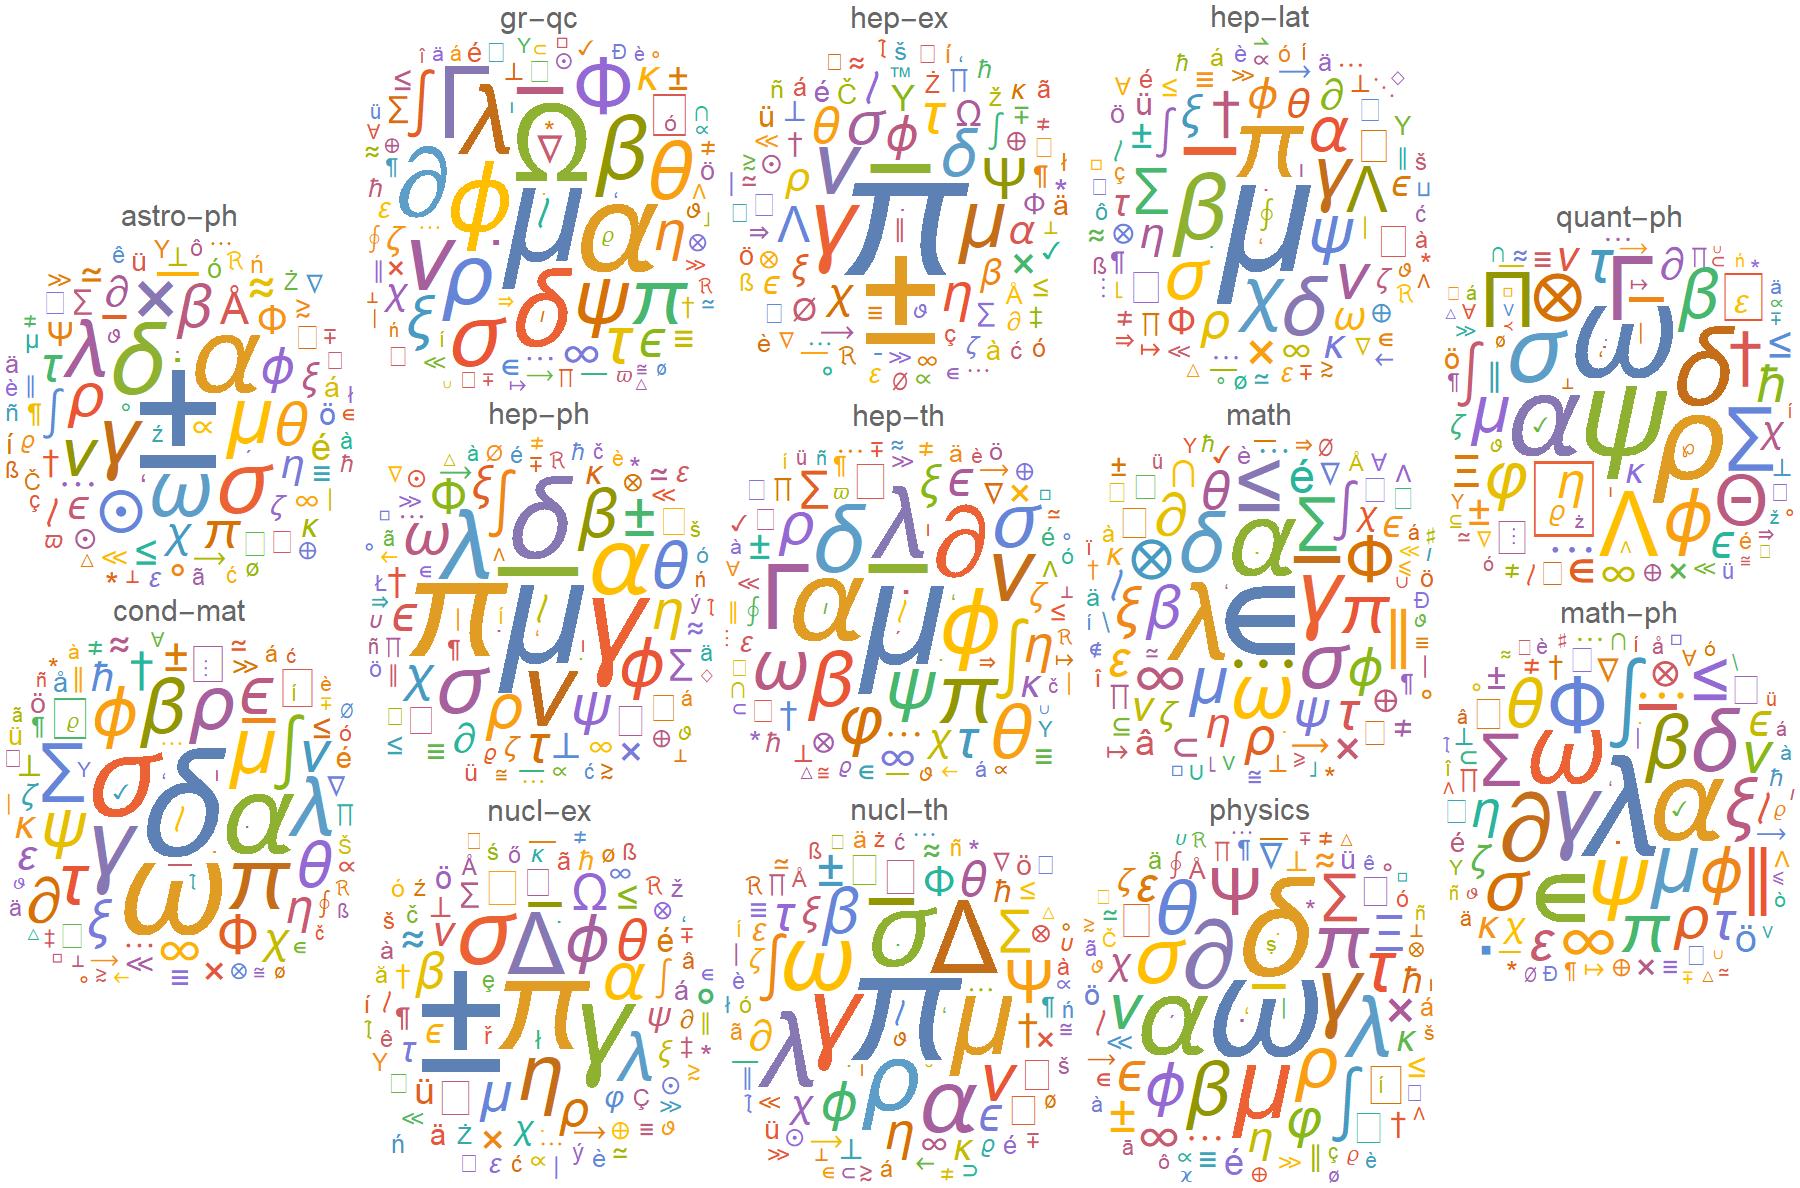 In order to make the above composite image we used the WL functions:
 Image and ImageAssemble. More detailed information about visualizations generated in this project can be found here.
Use data science techniques as a way for pattern recognition
The eventual goal of this research direction is to make use of machine learning techniques to see if we can get meaningful information about the scientific content of a paper, by studying the special characters used in it. We used a small subset of our fullDataset to characterize the meaning of each special character. Using the WL function Classify and non "stop"-words from titles as well as the symbols in the article we attempted to classify the articles by arXiv type for the year 2000. The following is a snippet of the code we used with Classify:
trainTitleWords[arXiv_] := Counts[Flatten@Normal@dataSet[arXiv][All, "Title"]];
trainSymbols[arXiv_] := Counts[Flatten@Keys@Normal@dataSet[arXiv][All, "Symbols"]];
trainBuzz[arXiv_] := Keys[Merge[{trainTitleWords[arXiv], trainSymbols[arXiv]}, Total]] ->
    arXiv;
trainingData = trainBuzz /@ arXives;
classifier = Classify[trainingData];
We then checked the performance of classifier on data from years other than 2000. We picked 881 articles for the test and found a low success rate of 319/881 (~ 36%). Clearly our classifier function needs more input. So the next idea is to construct a probability function for obtaining each arXiv type, given the different symbols that occur in a paper. In order to perform this task we will need to extract more information from our corpus.
Conclusions and future goals
While we are evidently far away from our original goal of understanding the usage of special characters in scientific articles, we have made considerable progress in setting up an initial database for analyzing titles and frequent symbols in arXiv articles. We used WL techniques to visualize our database. The future objective of this research will be to figure out direct connections between each symbol that appears in a paper and the text (keywords) in that paper, in order to create a dictionary for the symbols. With such a dictionary in hand one can then attempt to quantify the probability that an article represents a particular subject matter given the symbols in it.


