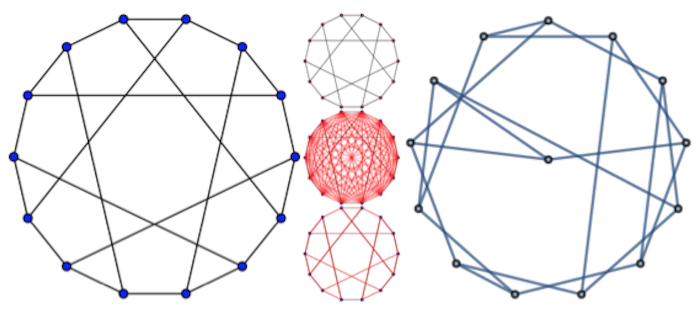
The main idea of the project is to be able to recognize the graphs from images grabbed from math papers.
Graphs represented as bunch of edges and vertices, but there is a problem. There are no vertices and edges and so on, only pixels. Pixels everywhere, do not try to leave Pixel City. Image might have a background or might not. The one of the ways to recognize what is it, vertex or edge, are the image transformations based on comparison of absolute values of pixels. Wolfram Mathematica has a rich set of instruments for image processing to complete this project.
This work was divided to three parts.
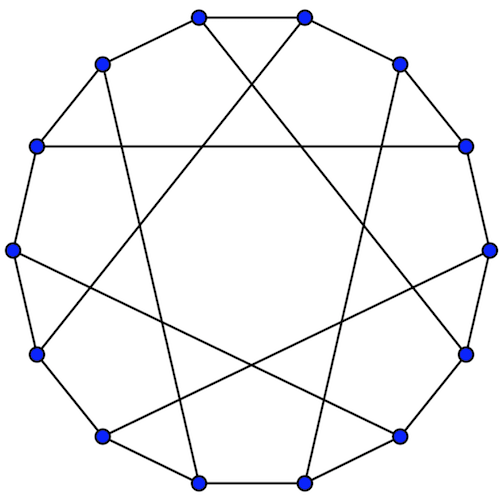
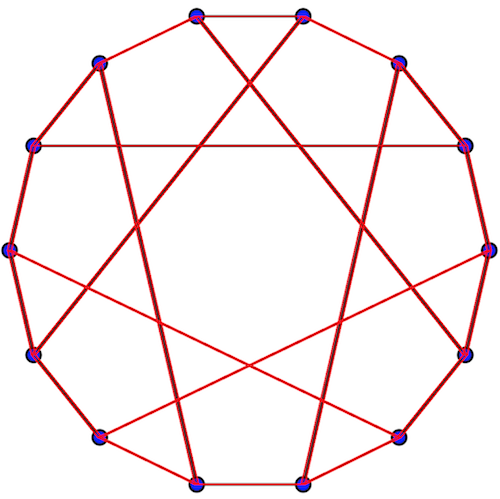
Part I: vertices identification. Usually vertices represented as centroids. Our test image have different colors for vertices and edges.
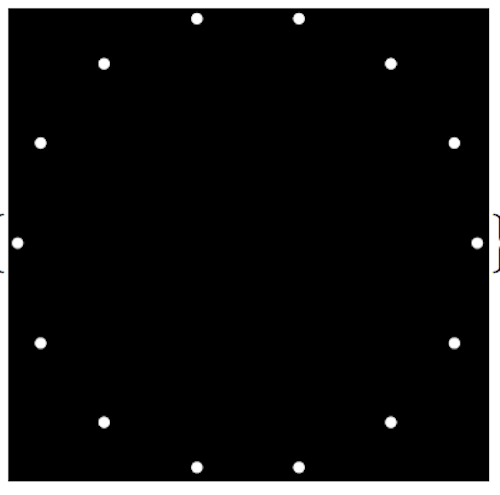
We selected ChanVeseBinarize symbol to divide an image to images that contains only vertices and only edges. DominantColors are essential for ChanVeseBinarize. But not all dominant colors are usefull, we don't need black color. Unfortunately, in this case edges are black, but it doesn't matter, we have the vertices.
dominantColors = DominantColors[img];
n = 10^-3;
usefulColors = Select[dominantColors, Total [Apply[List, #]] > n & ];
ChanVeseBinarize[img, # ] & /@ usefulColors
When vertices extracted, the ComponentMeasurements symbol usage is the best way to extract coordinates of centroids.
detectedVertices = ComponentMeasurements[img, "Centroid"]
Out[23]= {1 -> {470.829, 1151.73}, 2 -> {725.694, 1151.69},
 3 -> {238.851, 1039.25}, 4 -> {955.461, 1039.18},
 5 -> {80.4035, 841.676}, 6 -> {1113.86, 841.659},
 7 -> {22.9635, 591.45}, 8 -> {1171.3, 591.402},
 9 -> {80.4499, 341.036}, 10 -> {1113.85, 341.06},
 11 -> {238.851, 143.527}, 12 -> {955.422, 143.55},
 13 -> {470.784, 31.0343}, 14 -> {725.663, 31.0064}}
Vertices coordinates extracted! Let's check it.
highlightedVertices = HighlightImage[img, Values[detectedVertices]]
Part II: edge detection.
We decided to use Parallelograms to cover the region between two centroids.
There are no data about the region contains an edge, so we made all possible parallelograms between all vertices to cover the possible regions.
pairs = Subsets[Keys[detectedVertices], {2}];

generateParallelogram[pair_List] := Module[
  	{fstX, fstY, sndX, sndY},
  	 fstX := Values[detectedVertices[[pair[[1]]]]][[1]] - 5;
  	fstY := Values[detectedVertices[[pair[[1]]]]][[2]];
  	sndX := Values[detectedVertices[[pair[[2]]]]][[1]];
  	sndY := Values[detectedVertices[[pair[[2]]]]][[2]];
  Parallelogram[
   	{fstX, fstY},
   	 {
        {10, 0},
    	{sndX - fstX, sndY - fstY}
    	}
   	]
   ]
Caution: this function WANT to be optimised :) This excessive method can produce much noise, for example, when 2 edges lies on one line.
ImageMeasurement very helpful to get various information from the image. We need only Mean of the region covered by every parallelogram. AlphaChannel of the image helps to achieve better mean value of every region.
alphaChan = AlphaChannel[img];
mask[parallelogram_] :=
 Graphics[{White, parallelogram}, Background -> Black,
  PlotRange -> Tuples[{{0}, ImageDimensions[img]}]]
measurementOfPair[pair_] :=
  ImageMeasurements[alphaChan, "Mean",
    Masking -> mask[generateParallelogram[pair]]] > 0.5;
So, we had the pairs of vertices and the Means of all pixels inside parallelograms that connect the vertices. If the Mean value want to become 1.0 it seems like an white colored area, so edge detected!
In[31]:= measurementOfPair[{1, 10}]
Out[31]= True
We made the function that compares the Mean with the fixed value and filters the pairs of vertices.
In[32]:= edges = Select[pairs, measurementOfPair]
Out[32]= {{1, 2}, {1, 3}, {1, 10}, {2, 4}, {2, 9}, {3, 5}, {3, 13}, {4, 6}, {4, 14}, {5, 6}, {5, 7}, {6, 8},
 {7, 9}, {7, 12}, {8, 10}, {8, 11}, {9, 11}, {10, 12}, {11, 13}, {12, 14}, {13, 14}}
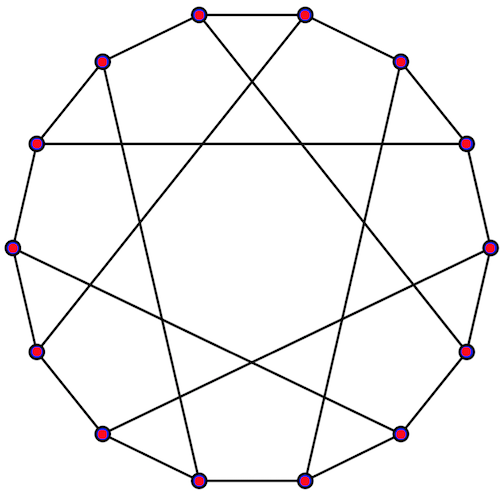
Part III: visual check and graph reconstruction.
After successful vertices and edge detection, we needed to make sure that these are correct data. We used HighlightImage with parallelograms of found edges.
highlightedEdges =
 HighlightImage[img, {Graphics[generateParallelogram[#]] & /@ edges }]
Number of edges is 21.
In[34]:= Length[edges]
Out[34]= 21
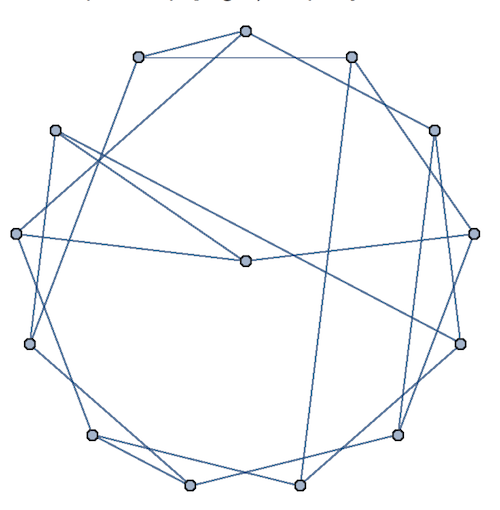
If all looks good, we can use Graph with given list of pairs and GraphLayout what we want. finalGraph = Graph[edges, GraphLayout -> "StarEmbedding"]
In[37]:= FullForm[finalGraph]

Out[37]//FullForm= \!\(
TagBox[
StyleBox[
RowBox[{"Graph", "[",
RowBox[{
RowBox[{"List", "[",
RowBox[{"1", ",", "2", ",", "3", ",", "4", ",", "5", ",", "6", ",",
        "7", ",", "8", ",", "9", ",", "10", ",", "11", ",", "12", ",",
         "13", ",", "14"}], "]"}], ",",
RowBox[{"List", "[",
RowBox[{
RowBox[{"UndirectedEdge", "[",
RowBox[{"1", ",", "2"}], "]"}], ",",
RowBox[{"UndirectedEdge", "[",
RowBox[{"1", ",", "3"}], "]"}], ",",
RowBox[{"UndirectedEdge", "[",
RowBox[{"1", ",", "10"}], "]"}], ",",
RowBox[{"UndirectedEdge", "[",
RowBox[{"2", ",", "4"}], "]"}], ",",
RowBox[{"UndirectedEdge", "[",
RowBox[{"2", ",", "9"}], "]"}], ",",
RowBox[{"UndirectedEdge", "[",
RowBox[{"3", ",", "5"}], "]"}], ",",
RowBox[{"UndirectedEdge", "[",
RowBox[{"3", ",", "13"}], "]"}], ",",
RowBox[{"UndirectedEdge", "[",
RowBox[{"4", ",", "6"}], "]"}], ",",
RowBox[{"UndirectedEdge", "[",
RowBox[{"4", ",", "14"}], "]"}], ",",
RowBox[{"UndirectedEdge", "[",
RowBox[{"5", ",", "6"}], "]"}], ",",
RowBox[{"UndirectedEdge", "[",
RowBox[{"5", ",", "7"}], "]"}], ",",
RowBox[{"UndirectedEdge", "[",
RowBox[{"6", ",", "8"}], "]"}], ",",
RowBox[{"UndirectedEdge", "[",
RowBox[{"7", ",", "9"}], "]"}], ",",
RowBox[{"UndirectedEdge", "[",
RowBox[{"7", ",", "12"}], "]"}], ",",
RowBox[{"UndirectedEdge", "[",
RowBox[{"8", ",", "10"}], "]"}], ",",
RowBox[{"UndirectedEdge", "[",
RowBox[{"8", ",", "11"}], "]"}], ",",
RowBox[{"UndirectedEdge", "[",
RowBox[{"9", ",", "11"}], "]"}], ",",
RowBox[{"UndirectedEdge", "[",
RowBox[{"10", ",", "12"}], "]"}], ",",
RowBox[{"UndirectedEdge", "[",
RowBox[{"11", ",", "13"}], "]"}], ",",
RowBox[{"UndirectedEdge", "[",
RowBox[{"12", ",", "14"}], "]"}], ",",
RowBox[{"UndirectedEdge", "[",
RowBox[{"13", ",", "14"}], "]"}]}], "]"}], ",",
RowBox[{"List", "[",
RowBox[{"Rule", "[",
RowBox[{"GraphLayout", ",", "\"\<StarEmbedding\>\""}], "]"}], "]"}]}],
      "]"}],
ShowSpecialCharacters->False,
ShowStringCharacters->True,
NumberMarks->True],
FullForm]\)
The graph represented as a symbol of Wolfram Language and ready for further computations.
Known issues: The algorithm works only with simple graphs and requires user's manual control.
Future work: The directions of future research might be in computer vision and machine learning domains. Main goals for future work is to be able to detect directed graphs and graphs with curved edges and total automation of the process.
GitHub: https://github.com/human-research/WSS17/blob/master/Project/GG/FinalCode.nb


