Abstract
GOAL OF THE PROJECT: To utilize sound feature in Mathematica to aid in understanding of concepts, as well as use Mathematica functions to apply computational knowledge to sound analysis.
SUMMARY OF WORK: The two largest pieces of the project were a sonification of the Doppler effect, and walking through how to import an audio file and then perform a fourier analysis on it to either recreate the sound yourself or gain knowledge of the signal data.
RESULTS AND FUTURE WORK: Both of those tasks proved quite difficult, and I wasn't able to perfect either one. For the Doppler effect, all that is left is to synchronize the playing of the noise to the movement of the car, and for the Fourier analysis, I still have to determine if having students do their own is possible/feasible. Also just general development of lesson plan, and potentially introduction of relativistic Doppler effect as well.
Results of Project
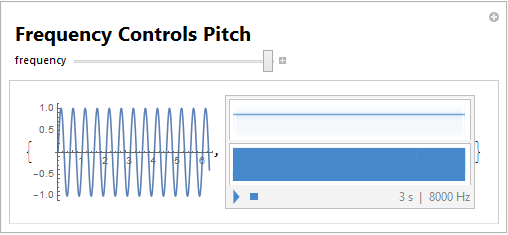
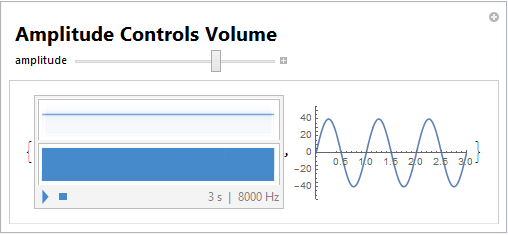
I was able to produce multiple interactive tools for attaching the experience of hearing what's happening to more mathematical representations of the the same instances:
 ,
, 
Using relatively simple pieces of code:
Manipulate[{Plot[Sin[(a/400) x 2 Pi], {x, 0, 2 Pi}],
  Play[Sin[a 2 Pi t], {t, 0, 3}]},
 Style["Frequency Controls Pitch", 20, Bold], {{a, 20, "frequency"},
  400, 800, 100}, ContinuousAction -> False]
and
Manipulate[{Sound[Play[Sin[800 2 \[Pi] t], {t, 0, 3}],
   SoundVolume -> a/1000],
  Plot[a Sin[2 Pi t], {t, 0, 3}, PlotRange -> {{0, 3}, {-55, 55}}]},
 Style["Amplitude Controls Volume", 20, Bold], {{a, 20, "amplitude"},
  1, 55, 1}]
respectively.
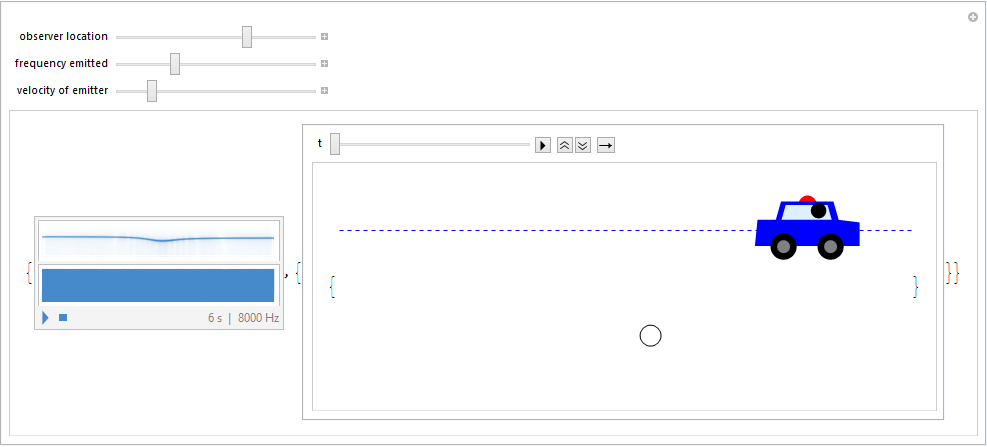
And additionally I worked on building a demonstration of the Doppler effect that included an audio facet so students can hear how changing each parameter changes the outcome and see the frequency over time represented in a graph. The largest obstacle here was getting the audio and the animation to start running at the exact same moment so it would be synchronized, and I haven't yet found a real solution to this issue; at the moment the animation has an extra two seconds on the front end so you have time to start it and then play the audio. But aside from that it runs well and I will continuing working on that problem as well as tweaking the aesthetic of the overall demo.
Manipulate[{Play[
   Sin[(340.29/(340.29 +
         v ((90 - v x)/Sqrt[d^2 + (90 - v x)^2])))^-1 2 Pi f x], {x,
    0, 6}], {Animate[{Graphics[{Circle[{-10, -d}, 2], Blue, Dashed,
       Line[{{-100, 0}, {80, 0}}], Red,
       Scale[Disk[{-100.` + v t, 5`}, .35], 5], Blue,
       Scale[Polygon[{{-102.6` + v t, 0}, {-102.5` + v t,
           1}, {-101.8` + v t, 1}, {-101.6` + v t,
           1.7`}, {-99.6` + v t, 1.7`}, {-99.39999999999999` + v t,
           1}, {-98.6` + v t, 0.9`}, {-98.6` + v t,
           0}, {-102.6` + v t, 0}}], 5], LightBlue,
       Scale[Polygon[{{-101.8` + v t, 3}, {-101.6` + v t,
           3.7`}, {-99.6` + v t, 3.7`}, {-99.39999999999999` + v t,
           3}}], 4], Black, Scale[Disk[{-98 + v t, 3.7}, 0.3], 5],
       GrayLevel[0], Scale[Disk[{-104.6 + v t, -3}, .5], 5],
       Scale[Disk[{-95.6 + v t, -3}, .5], 5], GrayLevel[.5],
       Scale[Disk[{-104.6 + v t, -3}, 0.25], 5],
       Scale[Disk[{-95.6 + v t, -3}, 0.25], 5]},
      PlotRange -> {{-70, 40}, {10, -32}},
      ImageSize -> Large]}, {t, -4, 6}, AnimationRepetitions -> 1,
    AnimationRunning -> False]}}, {{d, 20, "observer location"}, 0,
  30, 1}, {{f, 20, "frequency emitted"}, 400, 1100,
  100}, {{v, 20, "velocity of emitter"}, 25, 55, 1},
 ContinuousAction -> False, SaveDefinitions -> True]

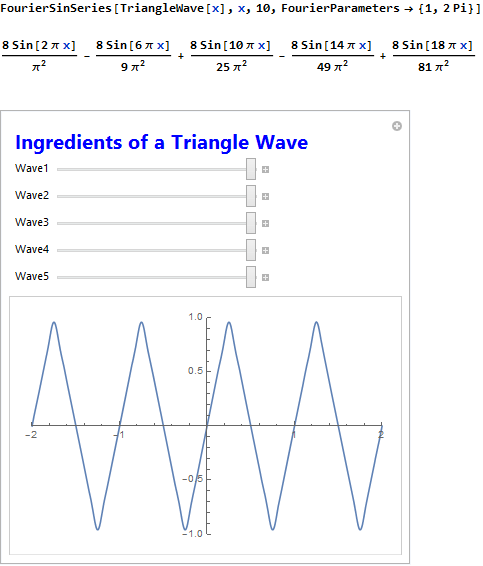
Finally, I worked on creating a module to make the concepts of Fourier transforms and analysis more accessible to students in a way that they could apply their own computational thinking to dissection of sound waves. At the moment I believe I've laid down a solid base for understanding with a few interactive tools:

The challenge now is to import an arbitrary sample of audio data and have a clear enough walkthrough that the student feels comfortable tackling that data on their own to analyze using various Mathematica functions and hopefully recreate a similar audio by rebuilding it in Mathematica.
Conclusion
Most of the success of this project will be derived from people's reception of it. I hope to get feedback from others about how they received these tools and if these tools seem like something that would be effective in teaching. I believe though that these demos have effectively captured a chance to utilize Mathematica in an impactful way, and I am still excited to resolve my issues with sound synching as well as Fourier analysis, and I will continue to update the layout and aesthetic of the notebook as I continue to attempt building a more effective lesson plan.
See my GitHub repository for access to relevant documents, named "Physics of Sound" which contains the mentioned lesson plan.
GitHub Repository