An Exploration Into How You Can Change the World
My original vision for this project was to create an app that could show you how to save the world.
More simply, to show where problems, inequalities, health issues, and hardship exists in the world, and then take some input from a user to show them where they could make the most impact with their interests and passions.
This demonstration is hopefully just the start. It currently shows maps, table, and correlation graphics for multiple data sets I found through UNICEF, WHO, World Bank, WANGO, and other repositories of similar organizations. It also shows all NGOs that are doing positive work around the world, to query when an issue is identified through the map and charts of other indicators.
The main data sets built in currently are: World Development Indicators, with over 1000 properties per country ranging from child labor statistics to electricity access %, DALYS, Disability Affected Life Years, measuring the effects of different medical conditions, and the NGO list, scraped from WANGO's repository.
First lets look at a few simple demonstrations of some capabilities I have built in so far, which all can me operated from the same DynamicModule panel through user interaction:
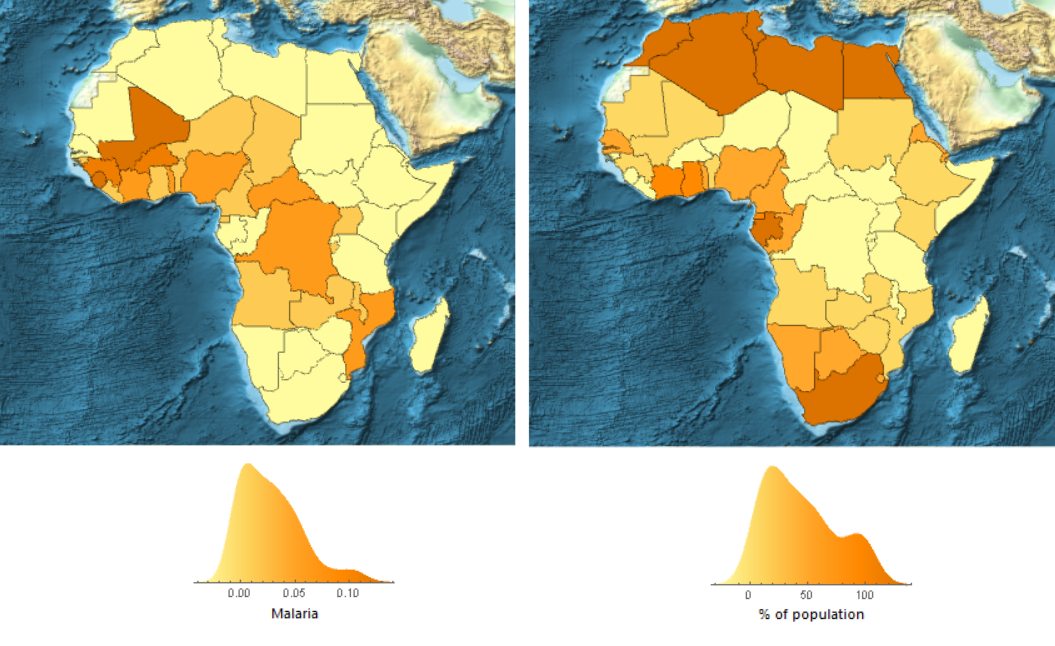
Malaria effects (in units of DALYS), and Electricity Access through Africa
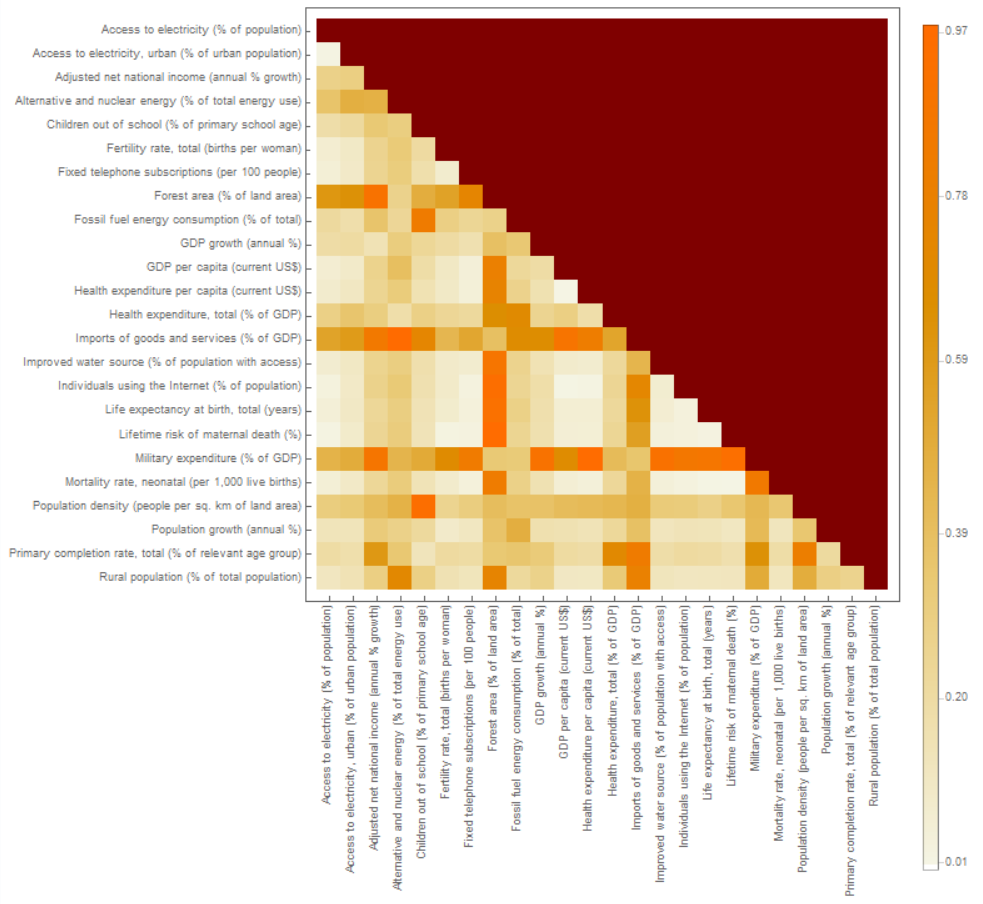
Correlation between selected World Development Indicators worldwide (p-values):
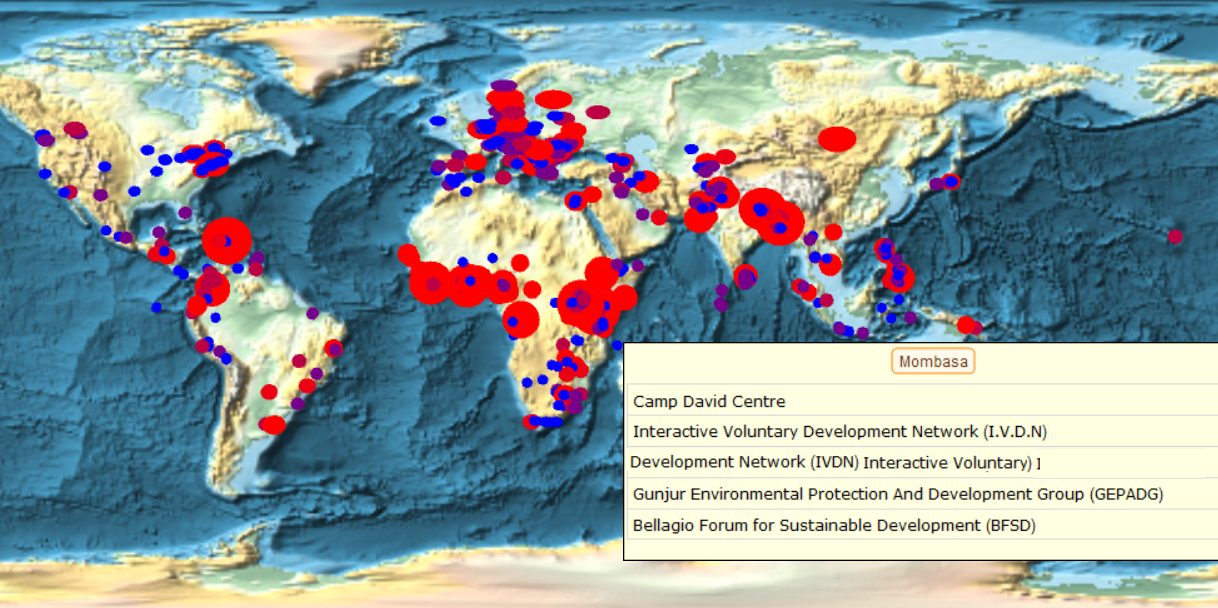
A map of all NGOs with environmental focus, and Mombasa selected:
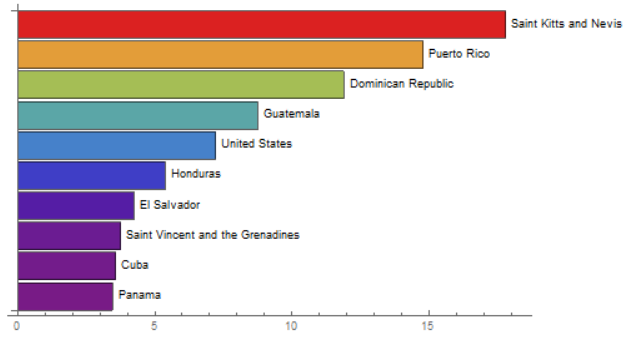
Percentage of children not enrolled in primary school in North America
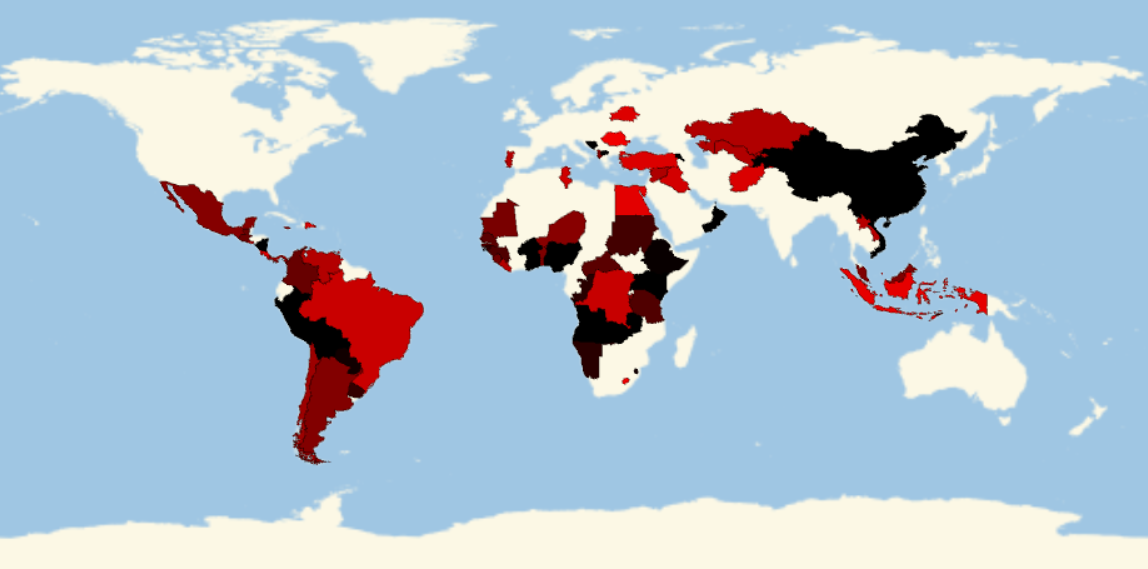
Eventually, with much more manual data curation necessary for this, I hope to make more options that allow users to select a specific issue and a specific general solution area, and create algorithms that use the other statistic to analyze the potential impact of this solution by country. I created one example of using IOT technology to help address problems affecting children around the world, which you can see below.
Harnessing IOT technology to help children around the world (Black shows high potential):
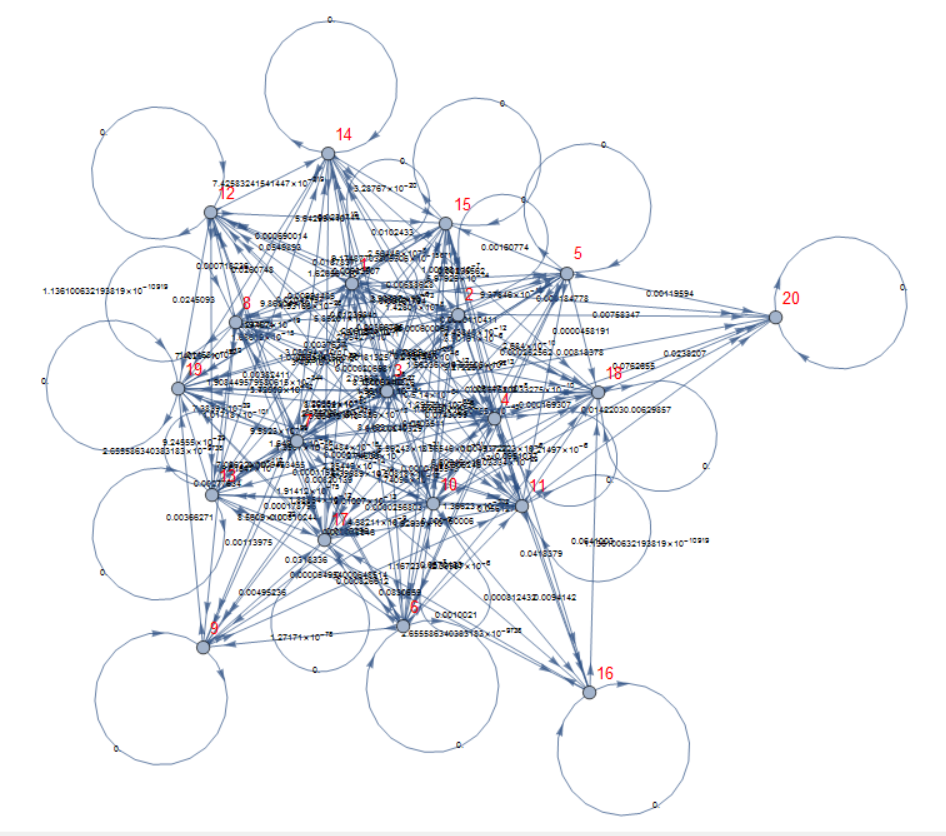
I've also been playing with some other ways to visualize the interconnectivity of the all the data I have, with some success:
Conclusions
I hope to expand the functionality of this prototype so it has more built in function to show you how to save the world, along my initial concept. Currently it gives some good ideas and can connect you with some good work being done around the world, so it is a good start. I have already used this tool many times this week to check things regarding areas I wish to study, focus in, or travel to, and so I know that it can be very useful and return some fascinating results. Thanks to Timothee, Mark, Vladimir, Gerli, Giulio for helping me through this project.
Code
There was a lot of code to get the data and visualizations prepared, but here at least is the code for the DynamicModule running the demonstration.
DynamicModule[
    {Property2 = Keys[(datasetList[[1]])][[2]], data=Flatten@Normal@Values@(datasetList[[1]][First@Keys@(datasetList[[1]])]),data2=Flatten@Normal@Values@(datasetList[[1]][First@Keys@(datasetList[[1]])]),
    Data=1, Graphic=1, Property=First@Keys@(datasetList[[1]]), Region = EntityClass["Country","Countries"],init=False,display},
Panel@Column[{
    SetterBar[Dynamic[Data],{1->"    Development Indicators   ",2->"    Health DALYS    ",3->"   NGO Distribution    "}],
    SetterBar[Dynamic[Graphic],{1->"   Distribution Map   ",2->"      Chart      ",3->"   Correlation Graph   "}],
    Dynamic[If[!MemberQ[Keys[datasetList[[Data]]], Property], Property=First@Keys[datasetList[[Data]]]];
    PopupMenu[Dynamic[Property],Keys@(datasetList[[Data]])]],
    PopupMenu[Dynamic[Region],
       {EntityClass["Country","Europe"],EntityClass["Country","SouthAmerica"],EntityClass["Country","NorthAmerica"],EntityClass["Country","Oceania"],EntityClass["Country","Asia"],EntityClass["Country","Africa"],\!\(\*
NamespaceBox["LinguisticAssistant",
DynamicModuleBox[{Typeset`query$$ = "all countries", Typeset`boxes$$ = TemplateBox[{"\"all countries, dependencies, and territories\"", RowBox[{"EntityClass", "[", RowBox[{"\"Country\"", ",", "\"Countries\""}], "]"}], "\"EntityClass[\\\"Country\\\", \\\"Countries\\\"]\"", "\"countries\""}, "EntityClass"], Typeset`allassumptions$$ = {{"type" -> "SubCategory", "word" -> "all countries", "template" -> "Assuming ${desc1}. Use ${desc2} instead", "count" -> "2", "Values" -> {{"name" -> "Countries", "desc" -> "all countries, dependencies, and territories", "input" -> "*DPClash.CountryEC.all+countries-_*Countries-"}, {"name" -> "SovereignCountries", "desc" -> "all sovereign countries", "input" -> "*DPClash.CountryEC.all+countries-_*SovereignCountries-"}}}}, Typeset`assumptions$$ = {}, Typeset`open$$ = {1, 2}, Typeset`querystate$$ = {"Online" -> True, "Allowed" -> True, "mparse.jsp" -> 0.6759569`7.281463999069408, "Messages" -> {}}},
DynamicBox[ToBoxes[AlphaIntegration`LinguisticAssistantBoxes["", 4, Automatic, Dynamic[Typeset`query$$], Dynamic[Typeset`boxes$$], Dynamic[Typeset`allassumptions$$], Dynamic[Typeset`assumptions$$], Dynamic[Typeset`open$$], Dynamic[Typeset`querystate$$]], StandardForm],
ImageSizeCache->{407., {8., 17.}},
TrackedSymbols:>{Typeset`query$$, Typeset`boxes$$, Typeset`allassumptions$$, Typeset`assumptions$$, Typeset`open$$, Typeset`querystate$$}],
DynamicModuleValues:>{},
UndoTrackedVariables:>{Typeset`open$$}],
BaseStyle->{"Deploy"},
DeleteWithContents->True,
Editable->False,
SelectWithContents->True]\)}
    ],
    DynamicWrapper[
       PaneSelector[{
       1 ->
       PaneSelector[{
         True -> Labeled[
         Dynamic[GeoRegionValuePlot[
         data,GeoLabels->(Tooltip[#1,#2->#4]&),PlotLegends->False, GeoBackground->GeoStyling["ReliefMap"],MissingStyle->White,PlotLabel-> "Distribution Map",ImageSize->{Automatic,300}
         ], TrackedSymbols:>{data}],
         Labeled[
          Dynamic[SmoothHistogram[DeleteMissing@Values@data,
          ColorFunction->(ColorData["GeographyGradient"][#]&),
          Filling->Axis,
          Axes->{True,False},
          PlotRange->All
         ], TrackedSymbols:>{data}], Dynamic@unitSplit@Property,Bottom],Right
       ],
       False -> Plot[x^2,{x,1,4}]
       }, Dynamic[Data < 3]],
       2 ->
         Dynamic[BarChart[DeleteMissing[Values@SortBy[data,Values]][[-10;;]],ChartLabels->Placed[Keys@DeleteMissing[SortBy[data,Values]][[-10;;]],After],ColorFunction->"Rainbow",BarOrigin->Left,ImageSize->{Automatic,500}]],

       3 ->
       Dynamic[If[!MemberQ[Keys@(datasetList[[Data]]),Property2],Property2=Keys[(datasetList[[Data]])][[2]]];
         Column[{
         Dynamic[
          PopupMenu[Dynamic[Property2],Keys@(datasetList[[Data]])]],
         CorrelationTest[DeleteMissing[Transpose[{Rest[Values@data],Rest[Values@data2]}],1,2]],correlationPlot
       }]]
    },
    Dynamic[Graphic],
    ImageSize->Automatic
    ],
    {data=
       If[Region===EntityClass["Country","Countries"],
         Flatten@Normal@Values@(datasetList[[Data]][Property]),
         Normal@(datasetList[[Data]][Property][Region])],
       If[!MemberQ[Keys@(datasetList[[Data]]),Property2],
         Property2=Keys[(datasetList[[Data]])][[2]]];
         ,
    data2=
       If[Region===EntityClass["Country","Countries"],
         Flatten@Normal@Values@(datasetList[[Data]][Property2]),
         Normal@(datasetList[[Data]][Property2][Region])]},


    SynchronousUpdating -> False]}
    ]


]


