Introduction
Hi, I`m Anish Mahendran, and the goal of my project was to create an automated system to identify buildings from Satellite Imagery. This task was accomplished primarily using machine learning through convolution neural networks. The final result was a program which takes an input satellite image, and highlights all of the buildings within the image by segmenting the input image, and classifying each segmented region as either "contains a building" or "does not contain a building," using the neural network. The specific operation of the neural network and the segmentation algorithm are described below.
Creating and Training the Convolution Neural Network
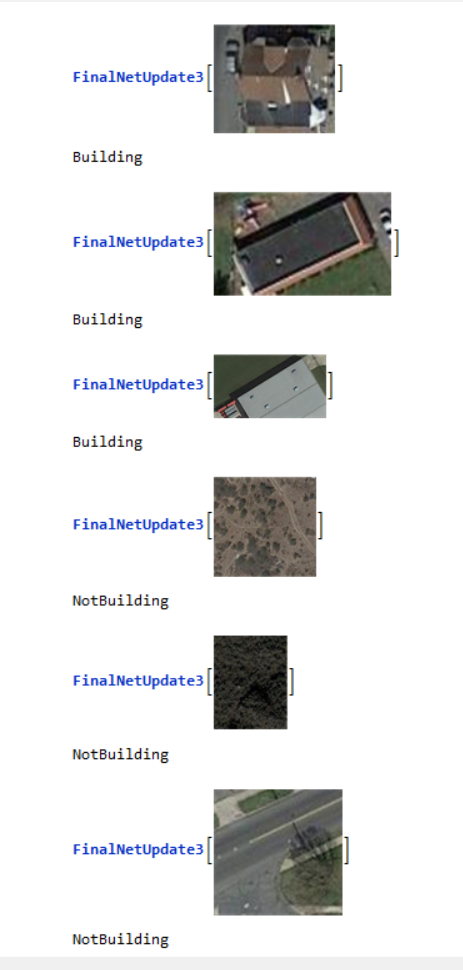
The first step was to create a Neural Network which could identify a single image as a building or not a building. The structure of this Neural Network is illustrated below:
lenet = NetChain[{
   ConvolutionLayer[30, 5], Ramp, PoolingLayer[2, 2],
   ConvolutionLayer[60, 5], Ramp, PoolingLayer[2, 2],
   FlattenLayer[], 700, Ramp, 2, SoftmaxLayer[]},
  "Output" -> NetDecoder[{"Class", {"Building", "NotBuilding"}}],
  "Input" -> NetEncoder[{"Image", {100, 100}, "RGB"}]
  ]
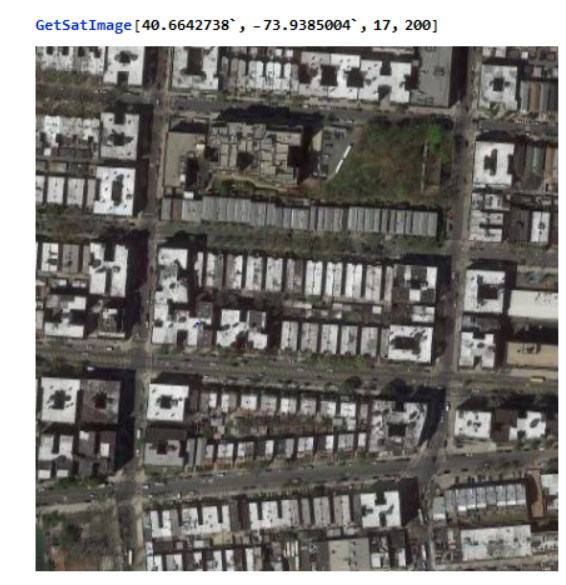
Next, it was necessary to provide this Neural Network with a vast set of training data in order to effectively identify a wide variety of building types, and to differentiate between buildings and visually similar structures such as roads and parking lots. Unfortunately I could not find any repository of satellite images which were classified in this form, so I had to generate this training data myself. In order to do so, the following procedure was used: First, the google maps api was used in order to get satellite images and street view images of different locations.
GetSatImage[x_, y_, zoom_, range_] :=
  Image[GeoGraphics[GeoPosition[{x, y}],
    GeoServer -> \
{"http://mt0.google.com/vt/lyrs=s&x=`2`&y=`3`&z=`1`"},
    GeoRange -> Quantity[range, "Meters"], GeoZoomLevel -> zoom]];
GetStreetImage[x_, y_, zoom_, range_] :=
  Image[GeoGraphics[GeoPosition[{x, y}],
    GeoBackground -> GeoStyling["StreetMapNoLabels"],
    GeoRange -> Quantity[range, "Meters"], GeoZoomLevel -> zoom]];
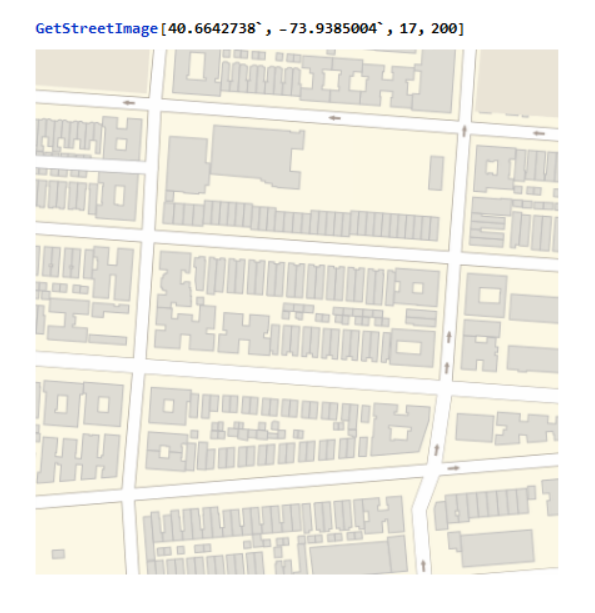
As illustrated in the above example, a building is represented by gray pixels within street view. By binarizing the street view Image and placing it atop the original satellite image, the following image is created.
HighlightImageParts[x_, y_, zoom_, range_] :=
  Module[{SatImage, StreetImage, B, configured, partioned, values,
    data, Replaced, color},
   SatImage = GetSatImage[x, y, zoom, range];
   StreetImage = GetStreetImage[x, y, zoom, range];
   color =
    RGBColor[{0.8705882352941177`, 0.8627450980392157`,
      0.8313725490196079`, 1.`}];
   Replaced = ColorReplace[StreetImage, color -> Black, 0.01];
   B = Binarize[Replaced, 0];
   configured = DeleteSmallComponents[ColorNegate[B], 10];
   HighlightImage[SatImage, configured]];
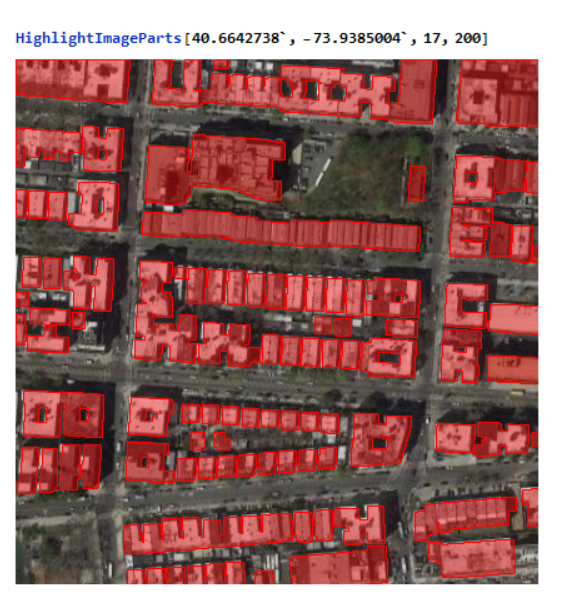
The street view Images were processed so that only the buildings (represented by gray in the street view image) remained, and the image was subsequently binarized and color-negated so that the buildings were represented by white, and all other components of the image were represented by black. This image was then segmented into 100 pixel by 100 pixel parts, and the mean color of each segment was calculated. If this mean exceeded 0.2, that would indicate an abundance of white pixels,so it must have contained a building. The following function takes in arguments of latitude, longitude, zoom level, and range, and returns a list of image segments followed by their building index (a value of above 0.2 represents the presence of a building).
AutoGenData[x_, y_, zoom_, range_, partSize_] :=
  Module[{SatImage, StreetImage, B, configured, partioned, values,
    data, Replaced, color},
   SatImage = GetSatImage[x, y, zoom, range];
   StreetImage = GetStreetImage[x, y, zoom, range];
   color =
    RGBColor[{0.8705882352941177`, 0.8627450980392157`,
        0.8313725490196079`, 1.`}]
      Replaced = ColorReplace[StreetImage, color -> Black, 0.01];
   B = Binarize[Replaced, 0];
   configured = DeleteSmallComponents[ColorNegate[B], 10];
   partioned = ImagePartition[configured, partSize];
   values = Map[1 - ImageMeasurements[#, "Mean"] &, partioned, {2}];
   data =
    Thread[Flatten[ImagePartition[SatImage, partSize]] ->
      Flatten[values]]];
This approach was used in order to generate approximately 8,000 classified images as the training data.
Image Segmentation (Naive Approach)
The above steps were used in order to generate a Neural Network which was quite effective at differentiating between images that are not buildings, and images that are.
Thus, in order to identify all of the buildings within a satellite image, the input image was cut into squares using the Image Partition function, and each part was individually classified.
NeuralNetImageCut[img_Image, partSize_Integer, function_] :=
  ImageAssemble[
   Map[If[function[#] == "Building", Blend[{#, Red}], #] &,
    ImagePartition[img, partSize], {2}]];
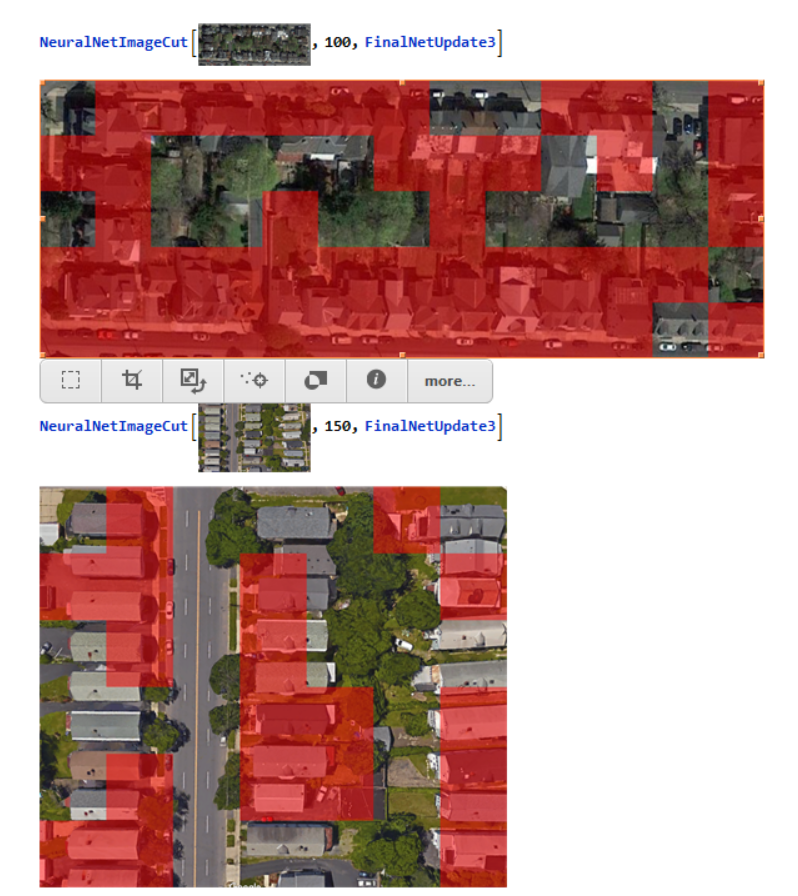
However, as illustrated in the above examples, this method is not entirely effective. The issue becomes more prevalent when buildings aren`t arranged in linear order (see below)
The primary cause of these inaccuracies is not entirely due to the ineffectiveness of the neural net. Instead, it is primarily a result of the ineffectiveness of the segmentation algorithm. Arbitrarily cutting the image in this manner results in many buildings being clipped (for instance, a given segment may just have one corner of a building). The Neural Network functions incredibly well when provided with a "convenient" crop containing the entire building, but when the image is cut in this manner, it is no longer possible to ensure that the Neural Network is provided with such conveniently cropped images. Thus, the following alternative algorithm was used:
Image Segmentation (Interpolation)
In order to expose the neural network to more orientations, and thus provide the algorithm with more opportunities to correctly identify the building, instead of simply cutting the image into segments, the algorithm would "pan" across the image and stop whenever it noticed something that the neural network would classify as a building. In other words, instead of cutting the image into disjoint parts, the images would have some overlap. This partition was generated using the ImagePartition function along with the secondary argument which specifies an "offset." The Neural Network was then applied to each resulting image, and the neural network`s certainty in whether or not the input was a building was recorded. The results were then plotted using an array plot.
TempMap[img_Image, function_, partSize_Integer, offset_Integer] :=
  ArrayPlot@
   Rescale@Clip[Rescale[Map[function[#, "Probabilities"]["Building"] &,
       ImagePartition[
        img, {partSize, partSize}, {offset, offset}], {2}]], {0, .5}];
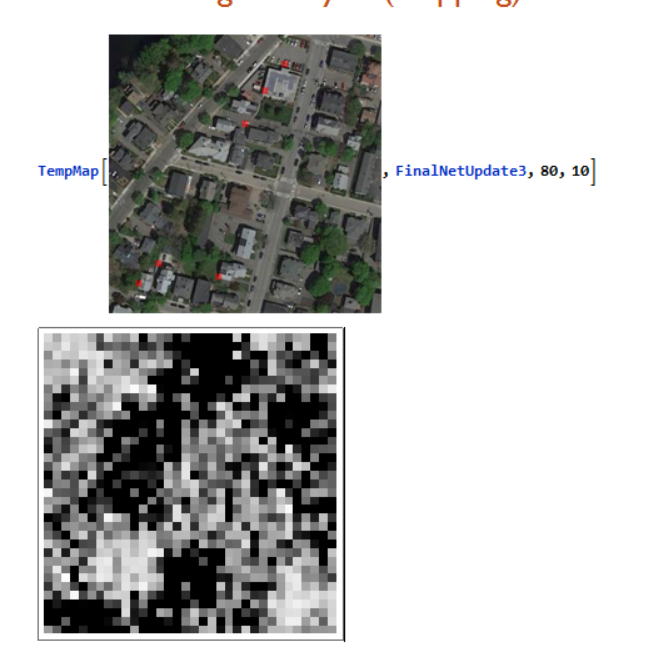
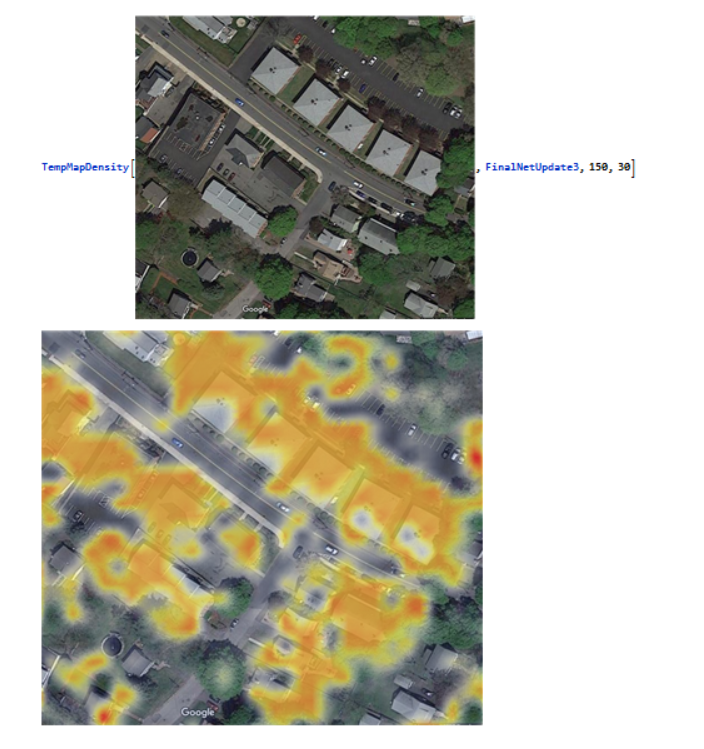
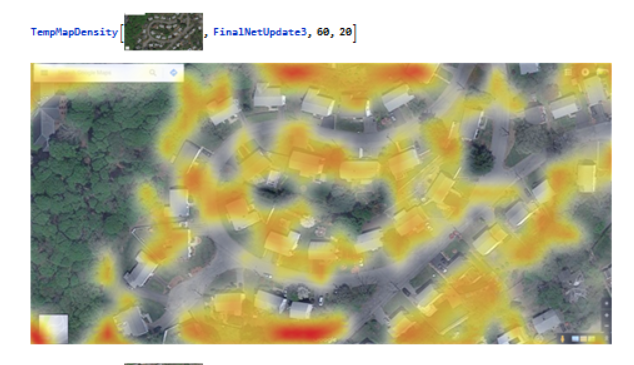
This "temperature map" of probabilities was processed using the interpolation function in order to make the results smooth and continuous. The resulting, interpolated function was then graphed using a density plot:
TempMapDensity[img_Image, function_, partSize_Integer,
   offset_Integer] := Module[{data, f, cfInt, cf, xr, yr, tempMap},
   data = TempMapData[img, function, partSize, offset];
   f = ListInterpolation[data];
   cfInt =
    Interpolation@
     Table[{p, Append[List @@ ColorData["TemperatureMap"][p], p]}, {p,
        0, 1, 0.05}];
   cf = RGBColor@*cfInt;
   {xr, yr} = Dimensions[data];
   tempMap =
    Rasterize[
     DensityPlot[f[xr + 1 - x, y], {y, 1, yr}, {x, 1, xr},
      ColorFunction -> (cf[#] &), PlotPoints -> 50,
      AspectRatio -> Divide @@ Dimensions[data], Frame -> False,
      Background -> None, PlotRangePadding -> None,
      ImagePadding -> None], Background -> None];
   ImageCompose[img, ImageResize[tempMap, ImageDimensions[img]]]];
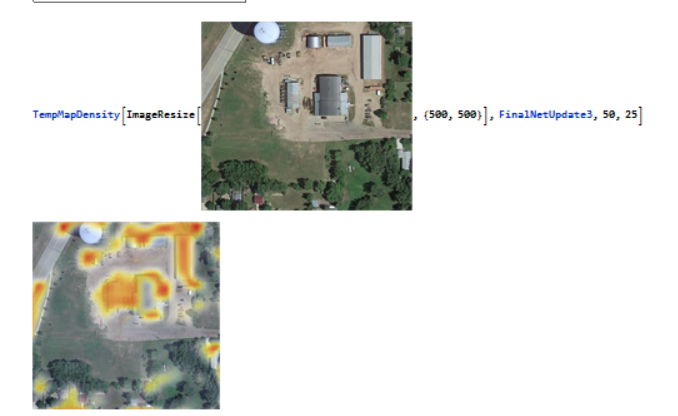
Sample Results
Conclusions and Extensions
In conclusion, this program was quite effective at identifying buildings from satellite images. However, there are multiple ways that this program could be improved. First, the size of the test data set could be increased dramatically by automating the process of generating test data (one could possibly make a web crawler which scans a large data set of satellite images in order to generate vast amounts of test data). Furthermore, the current program requires the user to specify the partition size and the offset value manually based on the zoom level of the image. It would be interesting to see this process automated so that the program automatically identifies the zoom level of the image. Future iterations of this program should also try to identify the edges of the buildings themselves once they have been localized to a given, so that the user could perform calculations such as identifying their relative sizes. This could possibly be accomplished through an image processing approach, identifying the gradients within the image, or through a machine learning approach, in which the neural network is trained to identify the vertices of the building.


